Open Access
Fig. A.2
Download original image
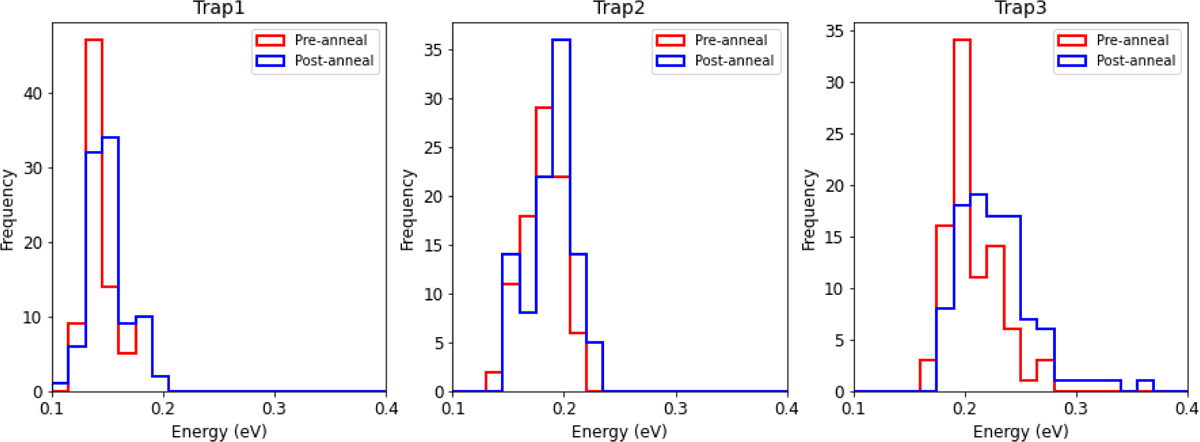
Distribution of the characteristic energy levels of the three trap species, from the best fit from the pre- and post-annealing epochs (from left to right: first, second, and third species).
Current usage metrics show cumulative count of Article Views (full-text article views including HTML views, PDF and ePub downloads, according to the available data) and Abstracts Views on Vision4Press platform.
Data correspond to usage on the plateform after 2015. The current usage metrics is available 48-96 hours after online publication and is updated daily on week days.
Initial download of the metrics may take a while.