Fig. 13
Download original image
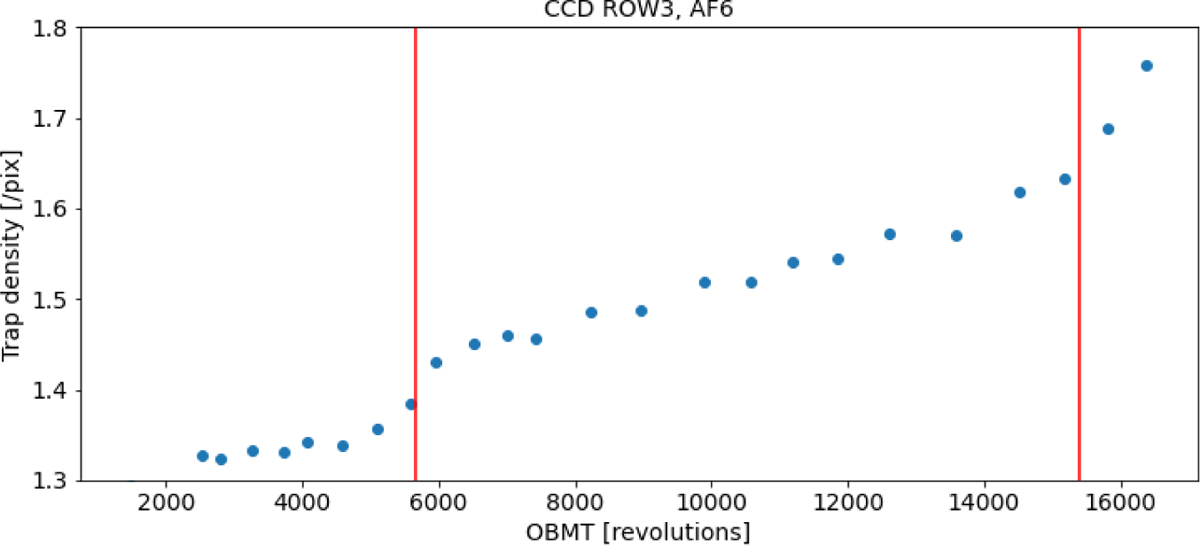
Evolution of the total density of traps for the CCD in row 3 and AF strip 6. The observed trend is caused by a gradual increase in damage caused by cosmic rays and sudden step jumps in correspondence to solar flares event, shown as the red lines for the class X8.2 flare of September 2017 and as the start of the intense period of solar activity during 2024.
Current usage metrics show cumulative count of Article Views (full-text article views including HTML views, PDF and ePub downloads, according to the available data) and Abstracts Views on Vision4Press platform.
Data correspond to usage on the plateform after 2015. The current usage metrics is available 48-96 hours after online publication and is updated daily on week days.
Initial download of the metrics may take a while.