Open Access
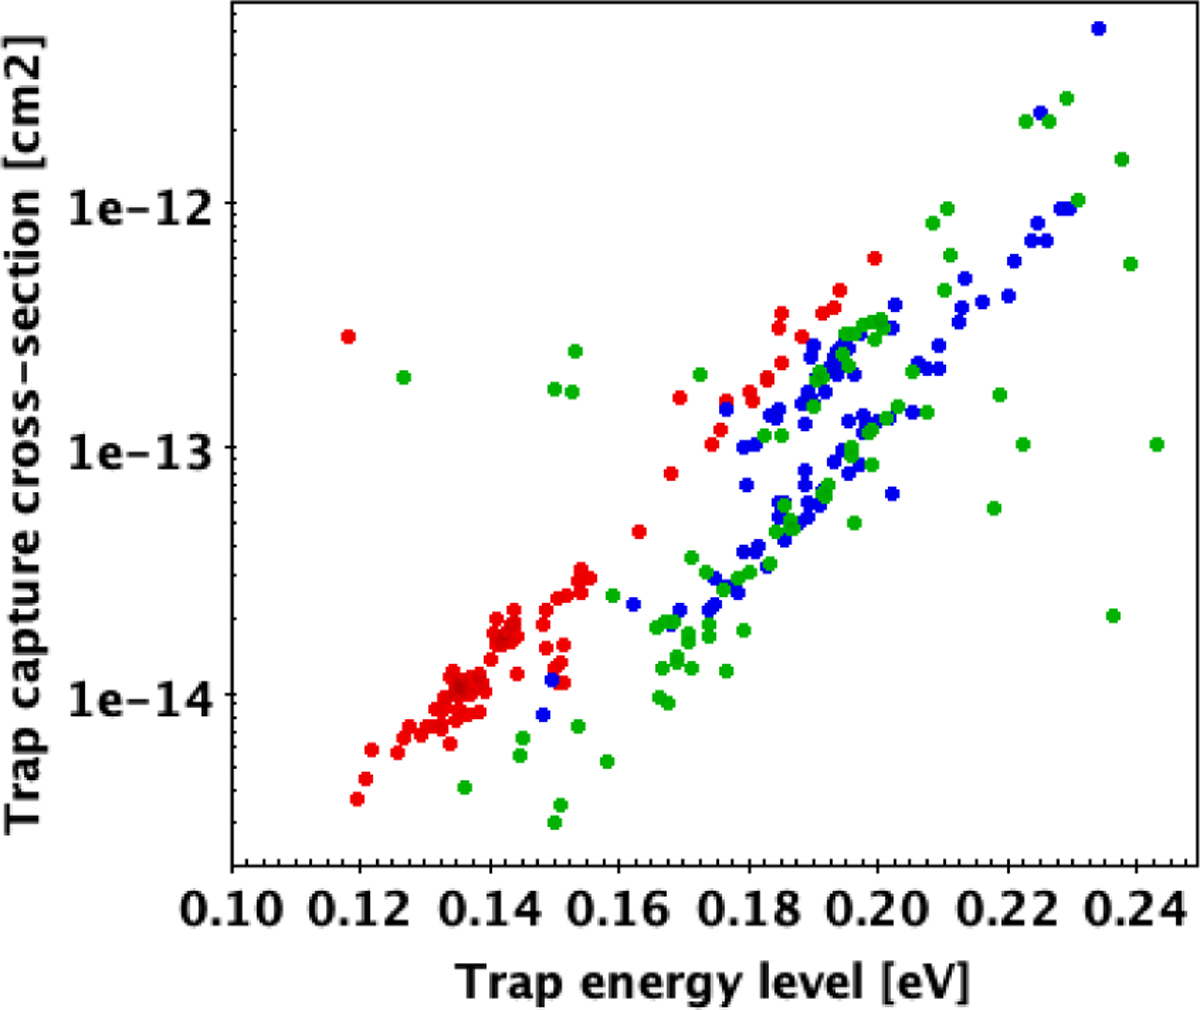
Fig. 12
Download original image
Scatter plot of the trap capture cross sections [cm2] vs. energy level [eV] for the model fits of the three-trap species to the entire Gaia mission dataset. The red, green, and blue dots are relative to the first, second, and third trap species in the CtiPixel model fit.
Current usage metrics show cumulative count of Article Views (full-text article views including HTML views, PDF and ePub downloads, according to the available data) and Abstracts Views on Vision4Press platform.
Data correspond to usage on the plateform after 2015. The current usage metrics is available 48-96 hours after online publication and is updated daily on week days.
Initial download of the metrics may take a while.