Fig. 10
Download original image
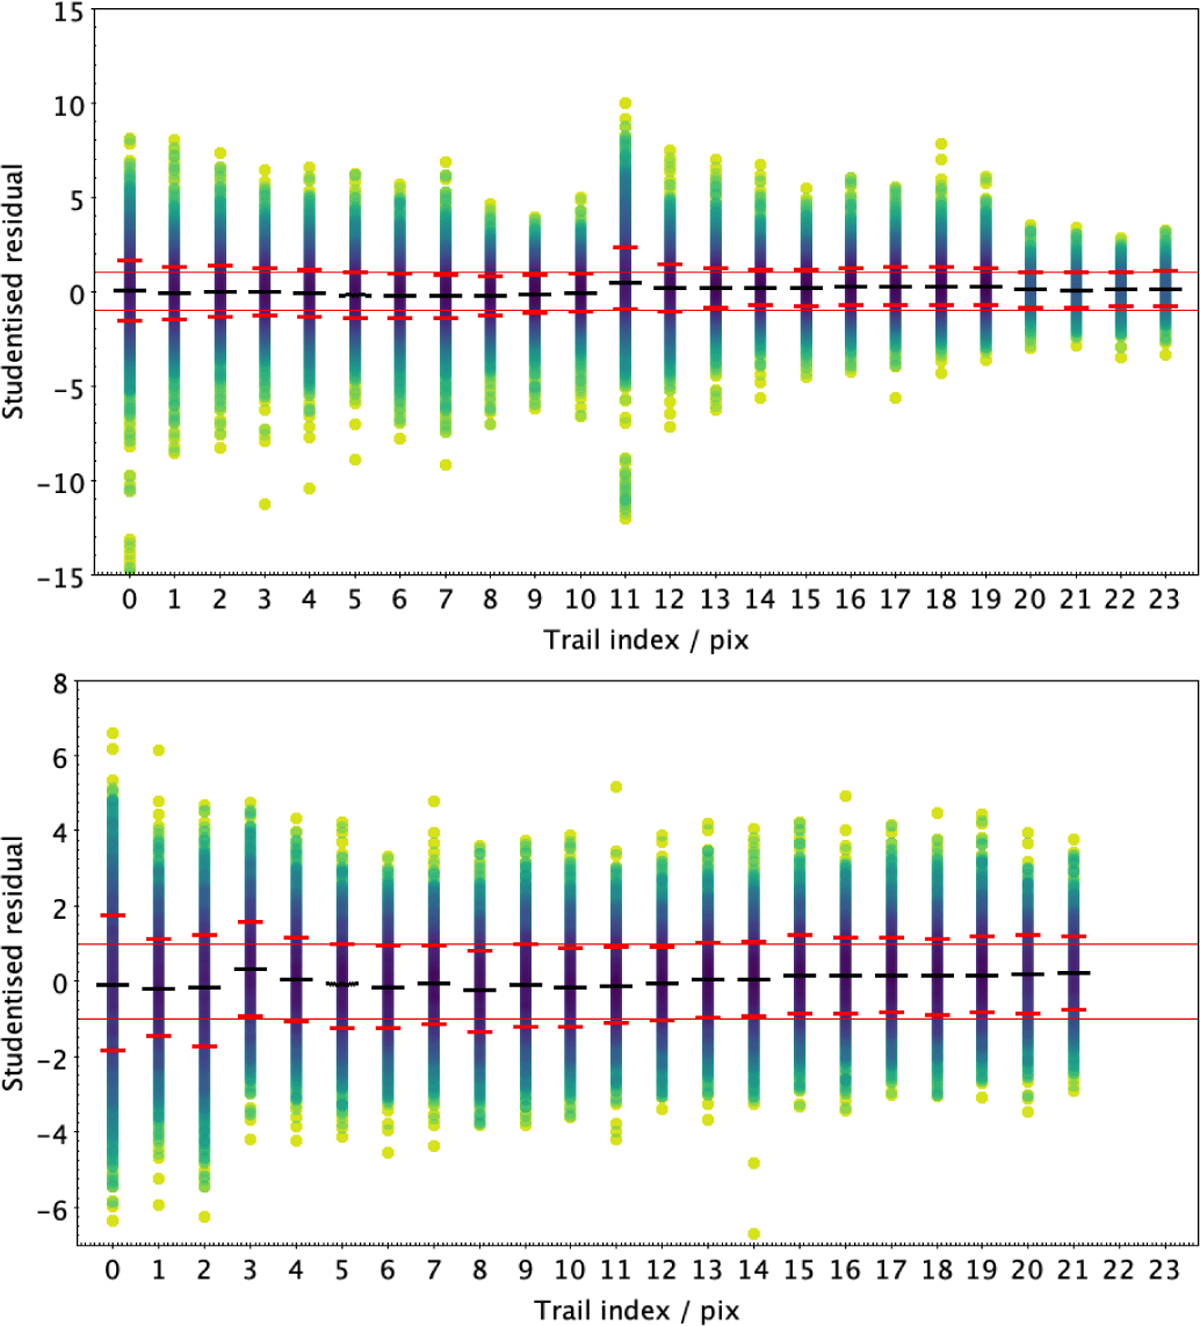
Studentised (unit-weight error) residuals as a function of trail position for all three-trap species calibrations. Upper panel: blue variant (AF+BP) devices. Lower panel: red variant (RP) devices. The thick dashed lines indicate the 16%, 50%, and 84% (red, black, and red) quantiles, which correspond to the distribution median ±1σ. The thin red lines show the ±1 expected position assuming normally distributed uncertainties.
Current usage metrics show cumulative count of Article Views (full-text article views including HTML views, PDF and ePub downloads, according to the available data) and Abstracts Views on Vision4Press platform.
Data correspond to usage on the plateform after 2015. The current usage metrics is available 48-96 hours after online publication and is updated daily on week days.
Initial download of the metrics may take a while.