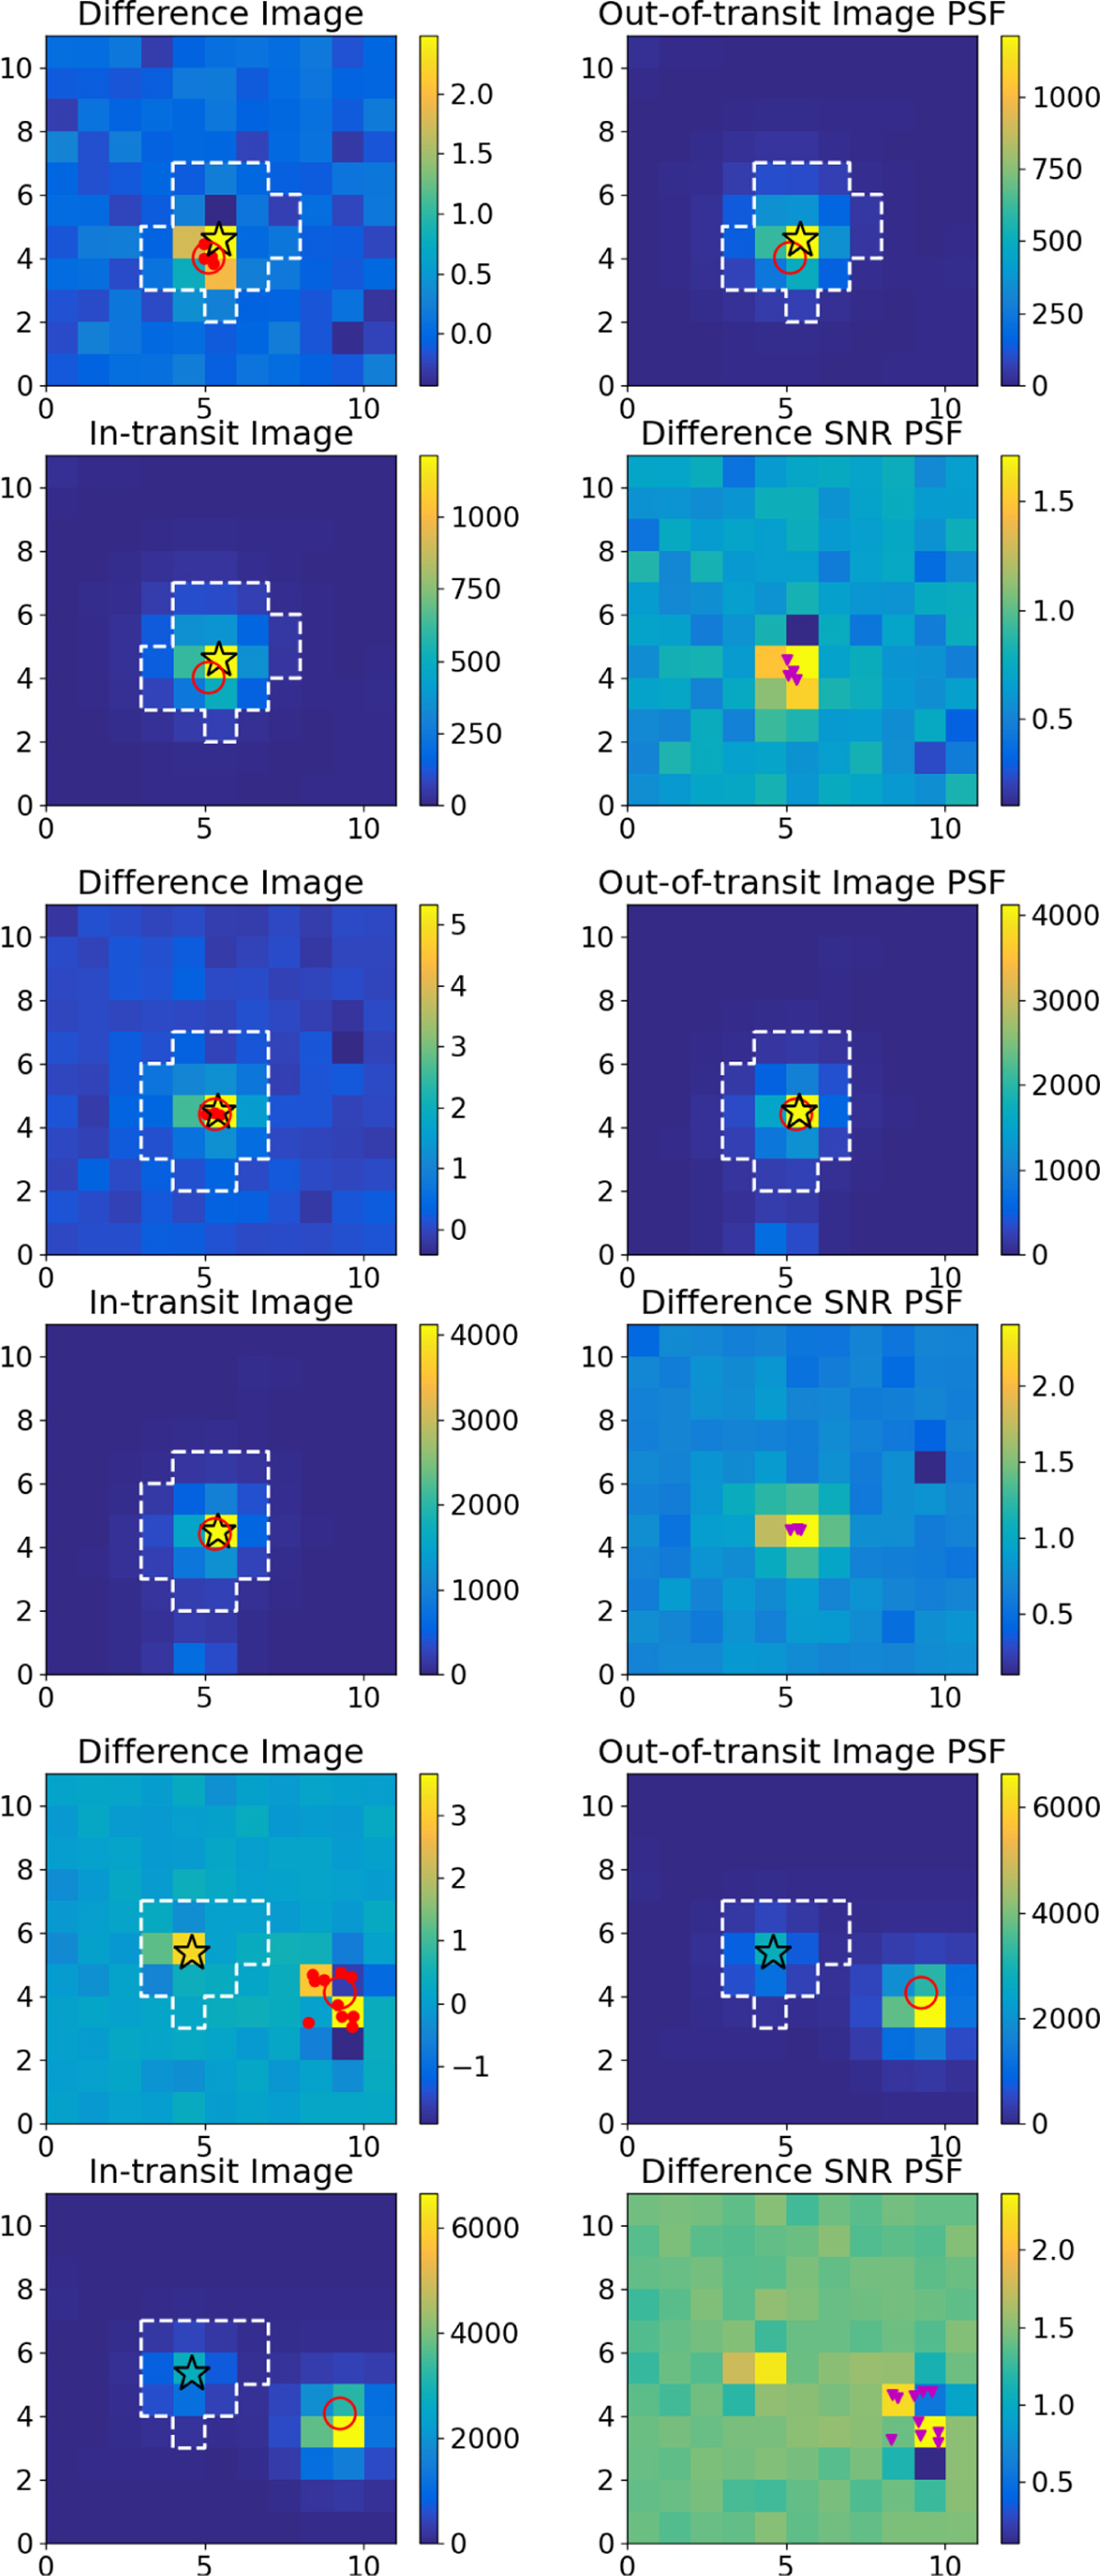
Fig. A.1
Download original image
Output from the centroids module for TOI-1243 b in TESS Sector 60 (top), for TOI-4529 b in TESS Sector 42 (middle), and for TOI-5388 b in TESS Sector 21 (bottom). The dashed white lines outline the aperture mask for LC extraction. A star symbol indicates the cataloged position of the target, while a purple triangle shows the average out-of-transit photocenter. Individual photocenters are marked by small red dots, and the large red circle denotes the overall difference image photocenter. The panels show: upper left – difference image; upper right – average out-of-transit image; lower left – average in-transit image; lower right – S/N of the mean difference image. A color bar indicates the number of electrons/sec for each case mentioned. The difference image reveals a centroid offset without artifacts slightly contaminated by the presence of a nearby source.
Current usage metrics show cumulative count of Article Views (full-text article views including HTML views, PDF and ePub downloads, according to the available data) and Abstracts Views on Vision4Press platform.
Data correspond to usage on the plateform after 2015. The current usage metrics is available 48-96 hours after online publication and is updated daily on week days.
Initial download of the metrics may take a while.