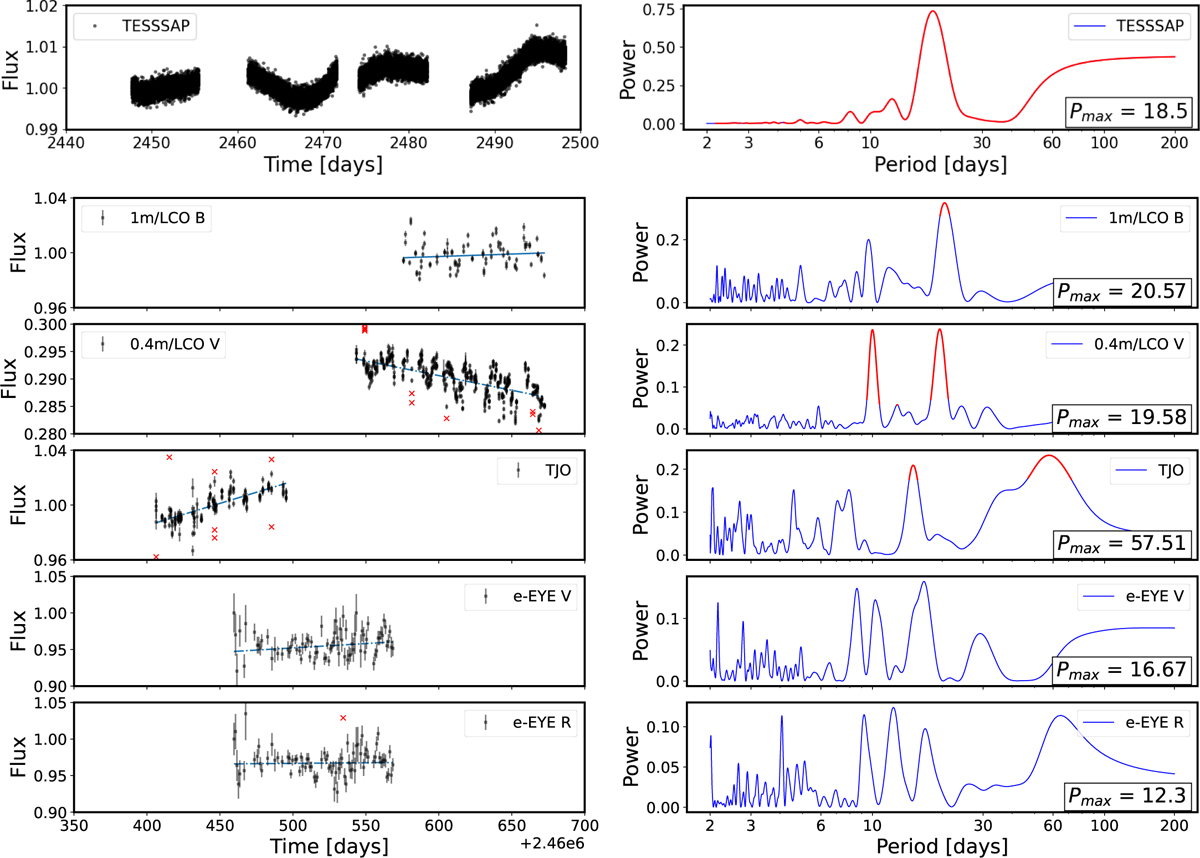
Fig. C.4
Download original image
Top: TESS SAP data for TOI-4529 of the consecutive Sectors 42, 43. Sector 70 is not included in this analysis to avoid the effect of the large-gap window function that appears in the periodogram. Bottom: Ground-based long-term photometric data for TOI-4529. The left panels show the relative flux. Red crosses mark are outliers not used in the analysis. The right panels show the GLS periodograms of the flux, with the horizontal dashed line showing the 3σ(0.13%) FAP, and the vertical red line showing the period of the most significant peak.
Current usage metrics show cumulative count of Article Views (full-text article views including HTML views, PDF and ePub downloads, according to the available data) and Abstracts Views on Vision4Press platform.
Data correspond to usage on the plateform after 2015. The current usage metrics is available 48-96 hours after online publication and is updated daily on week days.
Initial download of the metrics may take a while.