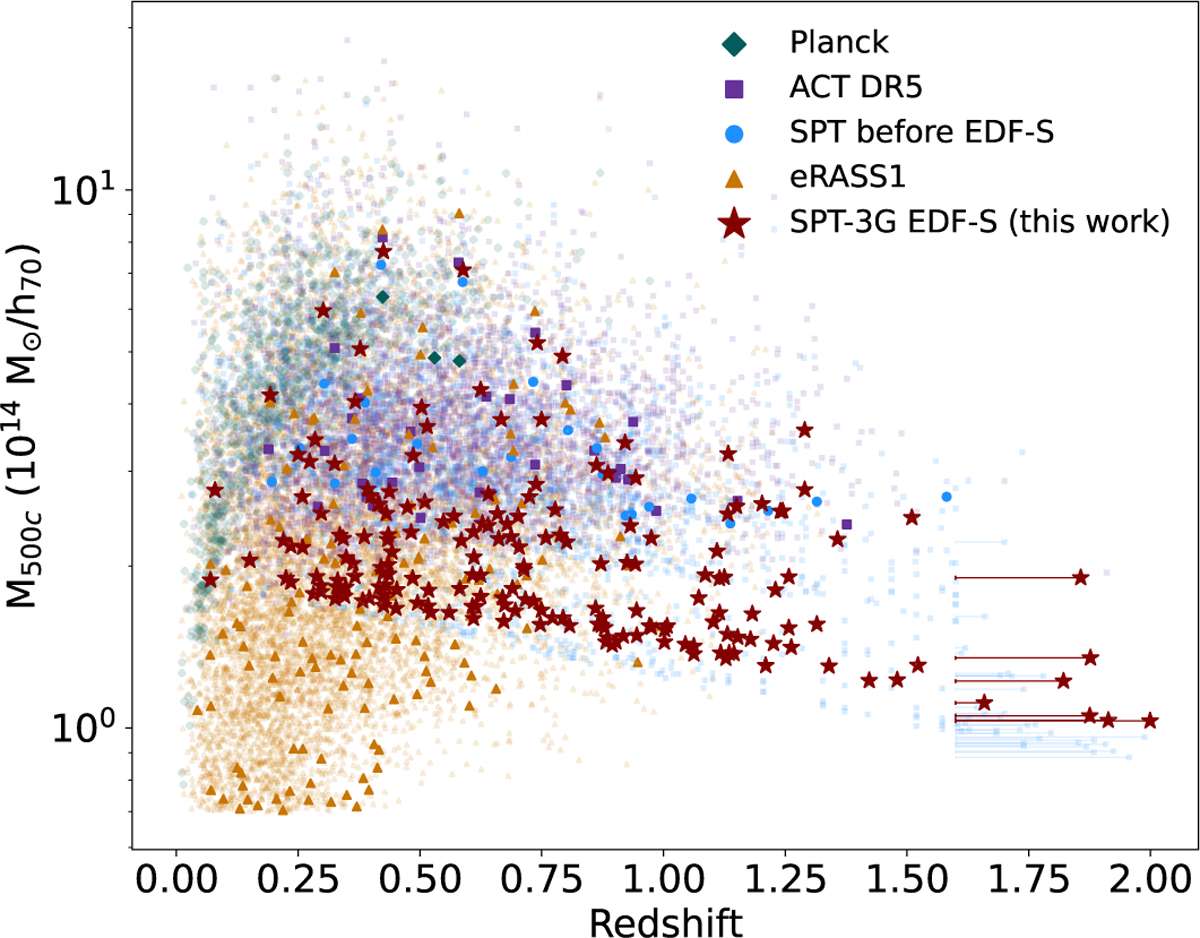
Fig. 8
Download original image
Mass versus redshift for the SPT-3G EDF-S cluster catalog compared to samples from other ICM-based wide field cluster surveys. In pale shading, we include all clusters from published catalogs and, in bold, clusters in the SPT-3G EDF-S footprint. We plot sources from this work (red stars), Planck (green diamonds, Planck Collaboration 2016b), ACT (purple squares, Hilton et al. 2021), eROSITA (orange triangles, Bulbul et al. 2024), and prior SPT samples (blue circles, Bleem et al. 2020; Klein et al. 2024a; Bleem et al. 2024; Kornoelje et al. 2025). The SPT-3G sample extends to significantly lower masses at high redshift than previously published works in the EDF-S region. Finally, note that as we only have lower redshift limits for SPT clusters at z > 1.6 (see Sect. 4.4.1), clusters at higher redshifts are plotted with redshifts drawn from a mass function for our fiducial ΛCDM cosmology.
Current usage metrics show cumulative count of Article Views (full-text article views including HTML views, PDF and ePub downloads, according to the available data) and Abstracts Views on Vision4Press platform.
Data correspond to usage on the plateform after 2015. The current usage metrics is available 48-96 hours after online publication and is updated daily on week days.
Initial download of the metrics may take a while.