Fig. 6
Download original image
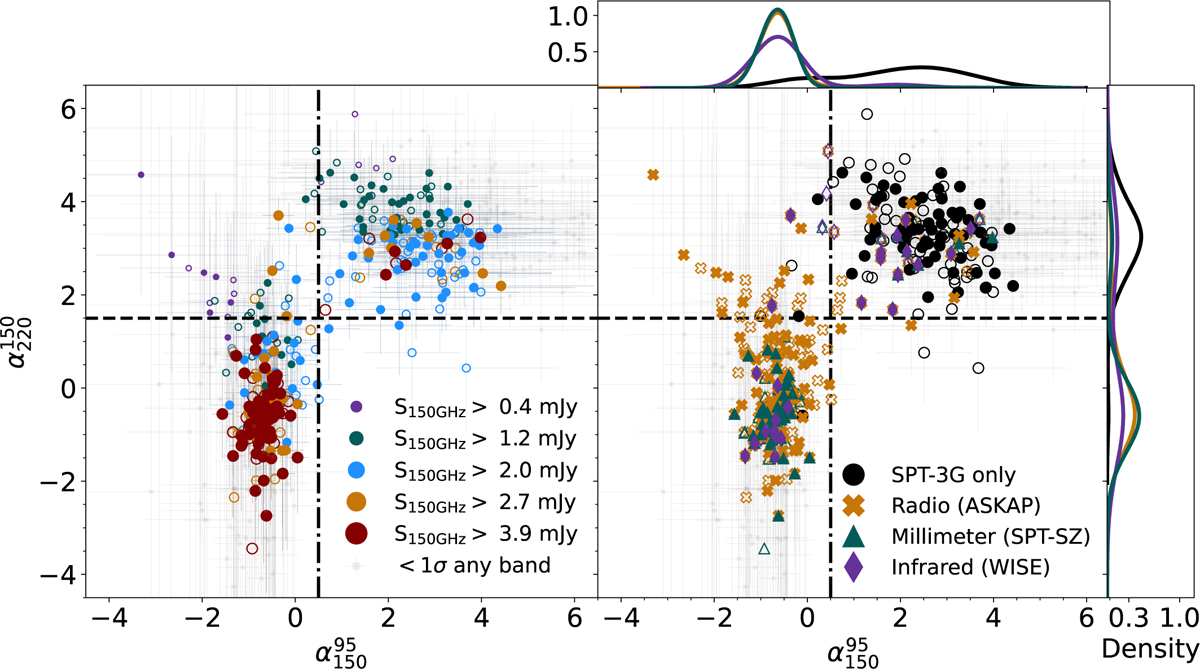
Source spectral indices between 150 and 220 GHz versus the spectral indices between 95 and 150 GHz. Note that 80 sources are omitted from the plots because their fluxes are below 0 and filled-in symbols indicate sources inside the EDF-S. Left panel : spectral indices that are color-coded according to their 150 GHz flux values: 0.4, 1.2, 2.0, 2.7, and 3.9 mJy are roughly equivalent to 1, 3, 5, 7, and 10σ detections. This view highlights the population separation between high signal-to-noise sources, which typically have synchrotron-dominated spectra, and dim sources which comprise the dusty population. Right panel : spectral indices that are represented by colors and symbols according to their external catalog associations (see the caption of Fig. 5). In this view, we emphasize that sources with dust-dominated spectra are uniquely discovered by low-noise millimeter-wavelength surveys such as those conducted by the SPT. The top and right panels are the kernel density estimations of each α axis, showing the bimodal distributions in both ![]() and
and ![]() but especially how
but especially how ![]() can be used to assign a spectral type of synchrotron or dusty; in this analysis, we adopted the cutoff value of
can be used to assign a spectral type of synchrotron or dusty; in this analysis, we adopted the cutoff value of ![]() = 1.5 (marked by dotted lines).
= 1.5 (marked by dotted lines).
Current usage metrics show cumulative count of Article Views (full-text article views including HTML views, PDF and ePub downloads, according to the available data) and Abstracts Views on Vision4Press platform.
Data correspond to usage on the plateform after 2015. The current usage metrics is available 48-96 hours after online publication and is updated daily on week days.
Initial download of the metrics may take a while.