Fig. 5
Download original image
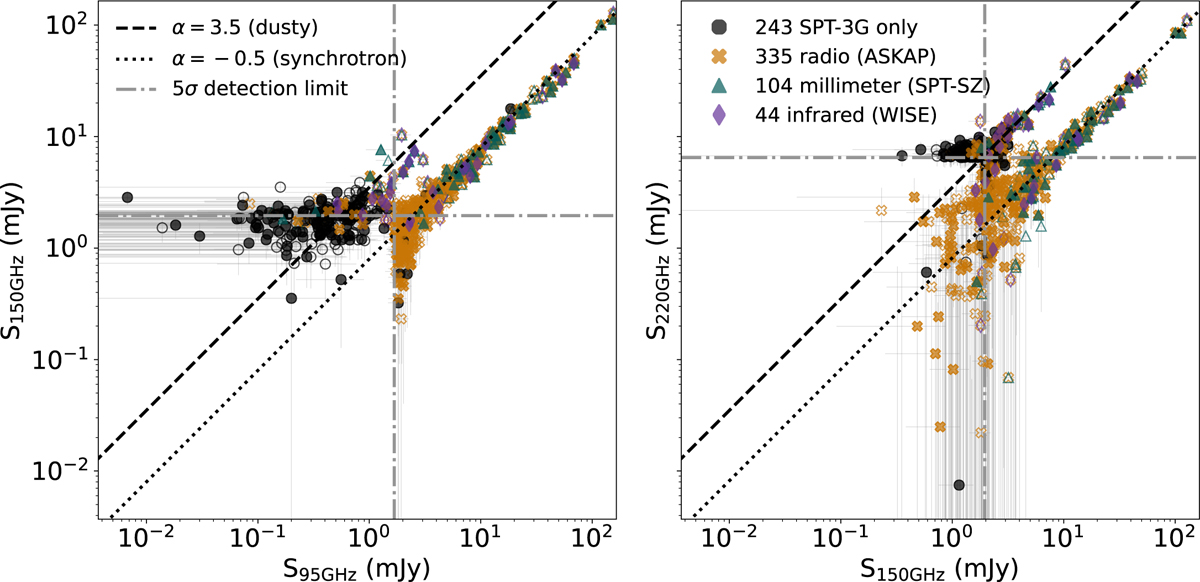
Comparison of the 150 GHz and 95 GHz fluxes (left panel) and the 220 GHz and 150 GHz fluxes (right panel) of entries in the emissive source catalog. The external counterparts of the sources are marked in black, orange, purple, and green to indicate no association, radio (ASKAP), infrared (WISE), and millimeter (SPT-SZ) associations, respectively. Sources inside the EDF-S footprint are indicated with filled-in symbols, and sources outside the footprint are left unfilled. We note that 37 sources are omitted from the left panel and 43 from the right because their flux values are negative in one of the bands and thus cannot be log scaled. The negative fluxes are a result of noise fluctuations from forced photometry in a source’s non-detection band. Of the 80 omitted sources, 37 have no associations, 42 have radio counterparts, and one has an infrared counterpart. We also indicate typical spectral indices for synchrotron (α = −0.5) and dusty (α = 3.5) sources as dotted and dashed lines, respectively. Finally, we show the 5σ detection thresholds for catalog admission as dot-dash lines. In general, the brightest objects are synchrotron-dominated AGNs and the dimmest objects are dust-dominated DSFGs.
Current usage metrics show cumulative count of Article Views (full-text article views including HTML views, PDF and ePub downloads, according to the available data) and Abstracts Views on Vision4Press platform.
Data correspond to usage on the plateform after 2015. The current usage metrics is available 48-96 hours after online publication and is updated daily on week days.
Initial download of the metrics may take a while.