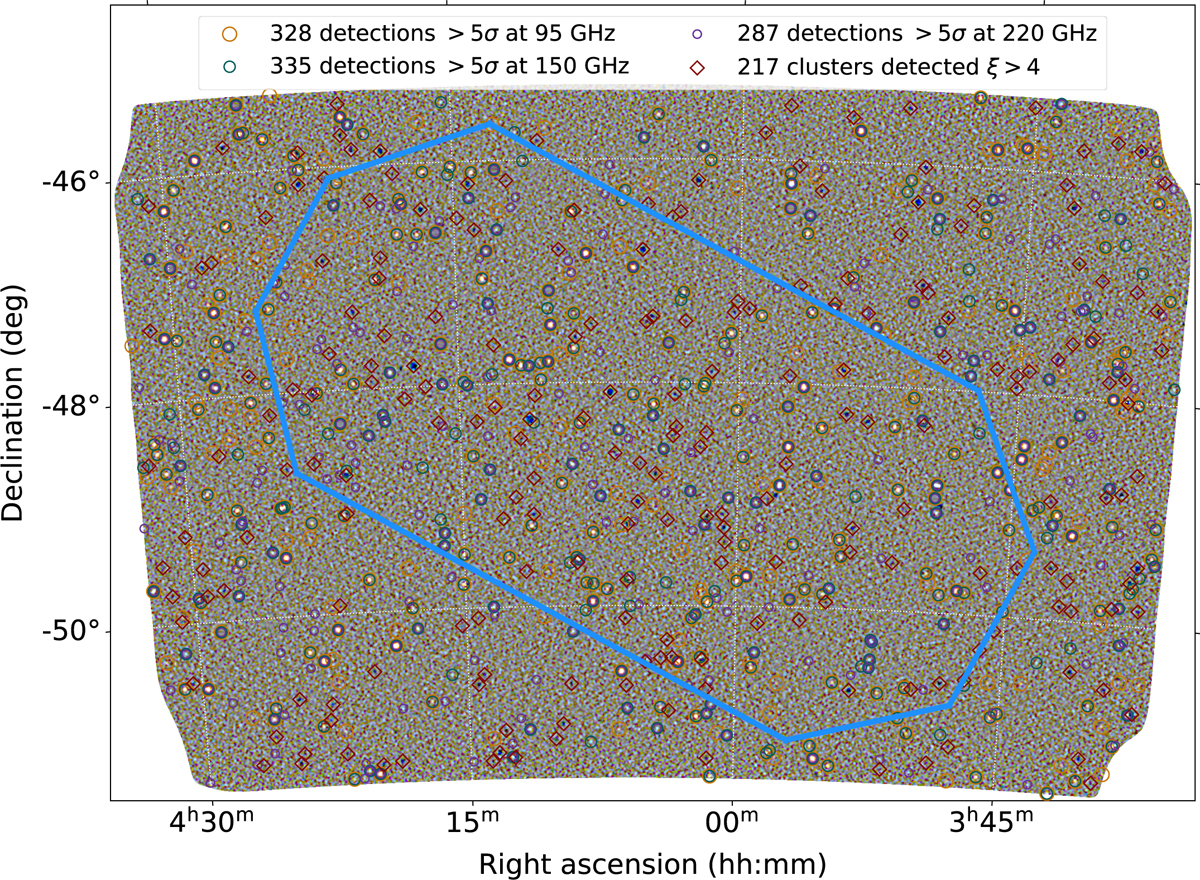
Fig. 4
Download original image
Maps of the SPT-3G 57-square-degree clean beam in RGB color channels, with R=95 GHz, G=150 GHz, and B=220 GHz. The image was generated using the stiff (Bertin 2012) command stiff clean_beam_map_ZEA_mJy_95GHz.fits clean_beam_map_ZEA_mJy_150GHz.fits clean_beam_map_ZEA_mJy_220GHz.fits -MIN_TYPE QUANTILE -MIN_LEVEL 0.001,0.03, 0.15 -MAX_TYPE QUANTILE -MAX_LEVEL 0.999,0.999,0.99 -GAMMA_LOG YES. Emissive source locations are indicated by colored circles (95, 150, and 220 GHz detections in orange, green, and purple, respectively) and 217 galaxy clusters are indicated by red diamonds. Bright spots are individual galaxies in the emissive source catalog and dark spots are tSZ galaxy clusters in the cluster catalog. The blue border indicates the EDF-S sky area observed by Euclid.
Current usage metrics show cumulative count of Article Views (full-text article views including HTML views, PDF and ePub downloads, according to the available data) and Abstracts Views on Vision4Press platform.
Data correspond to usage on the plateform after 2015. The current usage metrics is available 48-96 hours after online publication and is updated daily on week days.
Initial download of the metrics may take a while.