Fig. 3
Download original image
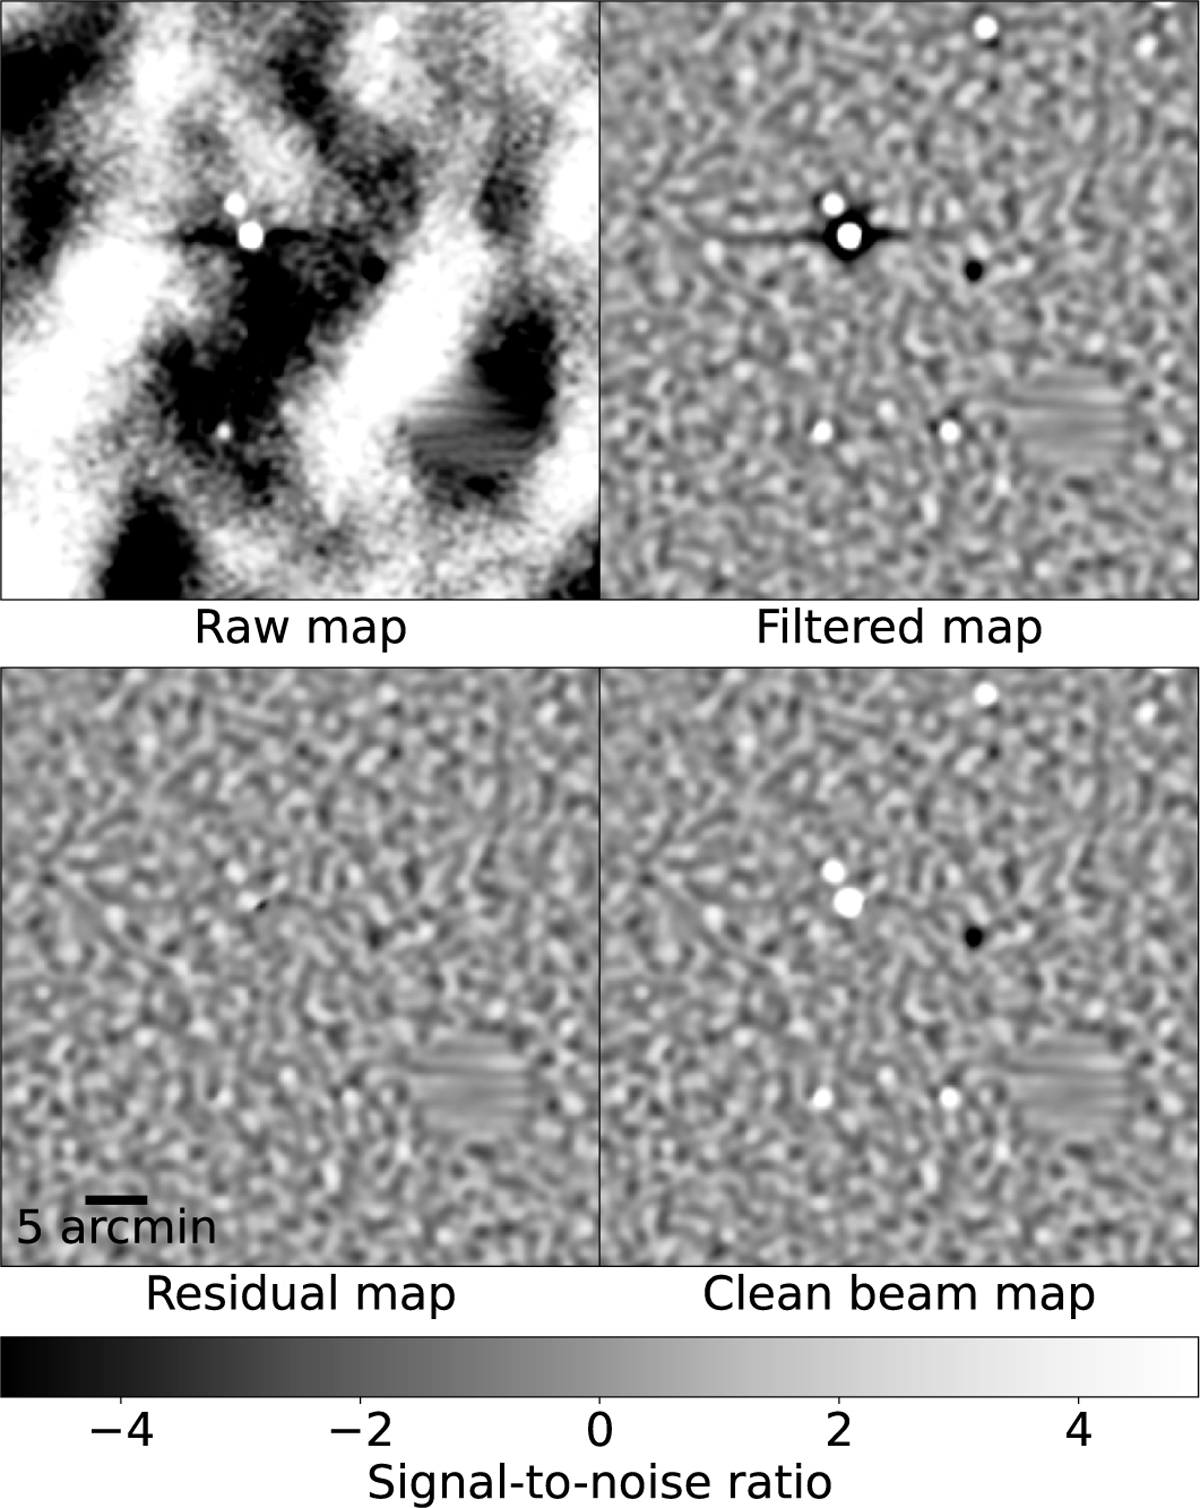
Each panel shows a major map processing step in the pointsource-finding procedure. For demonstration purposes, the 150 GHz map is shown; however, the coadd of each band undergoes source finding independently. Top left : coadded temperature map before any processing. On the same color scale as all other panels, we observe the large CMB fluctuations dominating the emissive sources and the galaxy cluster. The first step is to remove the CMB. Top right : map after an optimal filter has been applied and suppressed most of the CMB modes. The emissive galaxies are positive points with negative filtering wings around them. The galaxy cluster is a decrement. The second step is to remove the filtering effects around sources. Bottom left : residual map after applying a CLEAN algorithm, which iteratively removes “dirty beams” at the location of sources. The pixels left over in their place are just below the 5σ threshold. Bottom right : map after putting back in the “clean beam” at source locations without the filtering artifacts. This clean beam map is the image to which a simple pixel grouping algorithm was applied to generate the emissive source catalog. Note that while the cluster in this example is affected by the procedure, it is not optimal to find and characterize clusters using these methods, and therefore a separate pipeline was used. The disk feature in the lower right of all panels is an interpolated bright source (see Sect. 3.5).
Current usage metrics show cumulative count of Article Views (full-text article views including HTML views, PDF and ePub downloads, according to the available data) and Abstracts Views on Vision4Press platform.
Data correspond to usage on the plateform after 2015. The current usage metrics is available 48-96 hours after online publication and is updated daily on week days.
Initial download of the metrics may take a while.