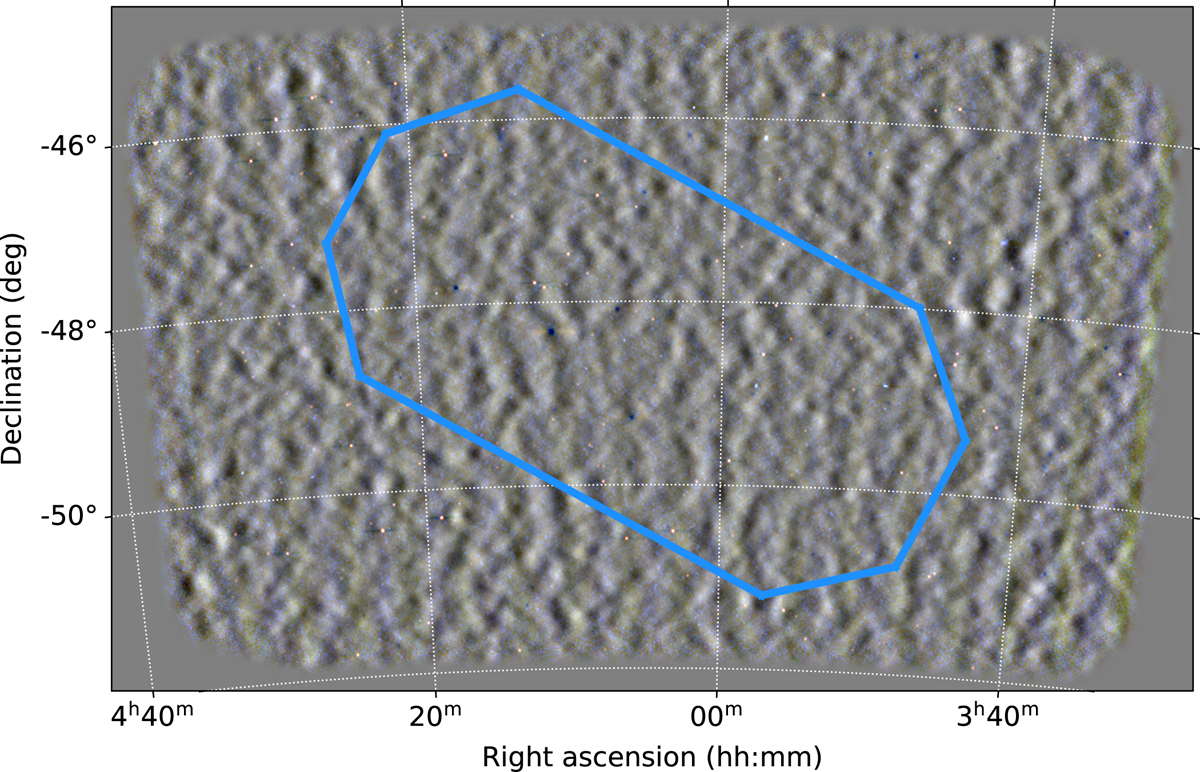
Fig. 2
Download original image
Approximate full-depth EDF-S sky footprint (shown in a blue outline) overlaid on top of the 57-square-degree SPT-3G coadded temperato maps in the ZEA projection. In this RGB image, the 95 GHz data are shown in the red channel, 150 GHz data are green, and 220 GHz data ar blue. The image was generated using the stiff (Bertin 2012) command stiff coadd_map_ZEA_95GHz.fits coadd_map_ZEA_150GHz.fit: coadd_map_ZEA_220GHz.fits -MIN_TYPE MANUAL -MAX_TYPE MANUAL -MIN_LEVEL -140 -MAX_LEVEL 140 -GAMMA. Notable feature of the map include the small-angular-scale CMB temperature fluctuations, emissive point sources which appear as red and blue bright dots and tSZ decrements from galaxy clusters which appear as compact dark spots. Artifacts from interpolated bright sources appear as discs of which a close-up is shown in Fig. 3. The map border is an apodized edge (apodization is described in Sect. 5.1).
Current usage metrics show cumulative count of Article Views (full-text article views including HTML views, PDF and ePub downloads, according to the available data) and Abstracts Views on Vision4Press platform.
Data correspond to usage on the plateform after 2015. The current usage metrics is available 48-96 hours after online publication and is updated daily on week days.
Initial download of the metrics may take a while.