Fig. 10
Download original image
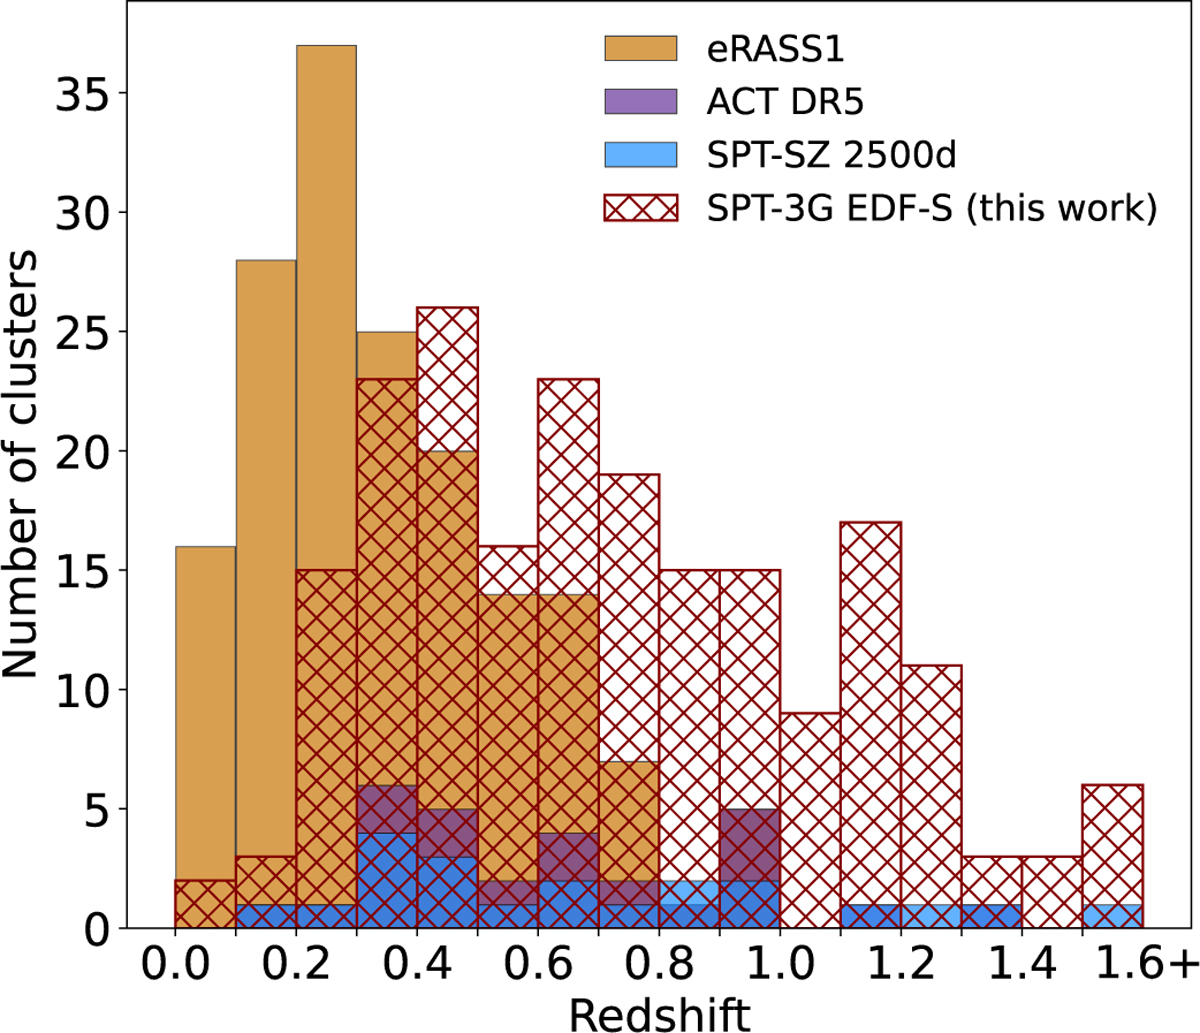
Redshift distribution of the SPT-3G EDF-S clusters and other ICM-selected clusters in the SPT-3G EDF-S footprint. The SPT-3G EDF-S cluster sample (red hatch pattern) has a median redshift of z = 0.70 and spans the range 0.07 < z ≲ 1.6 + . The eRASS1 (X-ray, yellow) subsample has 167 clusters, a median redshift of z = 0.32, and spans the range 0.04 < z < 0.99 (Kluge et al. 2024). The 29 ACT DR5 clusters have median redshift z = 0.58 and their redshifts span the range 0.19 < z < 1.38 (purple, Hilton et al. 2021). We also compared to the SPT-SZ subsample of 21 clusters (blue, Bleem et al. 2015; Klein et al. 2024a). This subsample has a median redshift of z = 0.58 and spans the range 0.24 < z < 1.38. The SPT-3G EDF-S cluster sample significantly increases the number of ICM-selected clusters in this patch, especially at high redshift (z > 1).
Current usage metrics show cumulative count of Article Views (full-text article views including HTML views, PDF and ePub downloads, according to the available data) and Abstracts Views on Vision4Press platform.
Data correspond to usage on the plateform after 2015. The current usage metrics is available 48-96 hours after online publication and is updated daily on week days.
Initial download of the metrics may take a while.