Fig. 10
Download original image
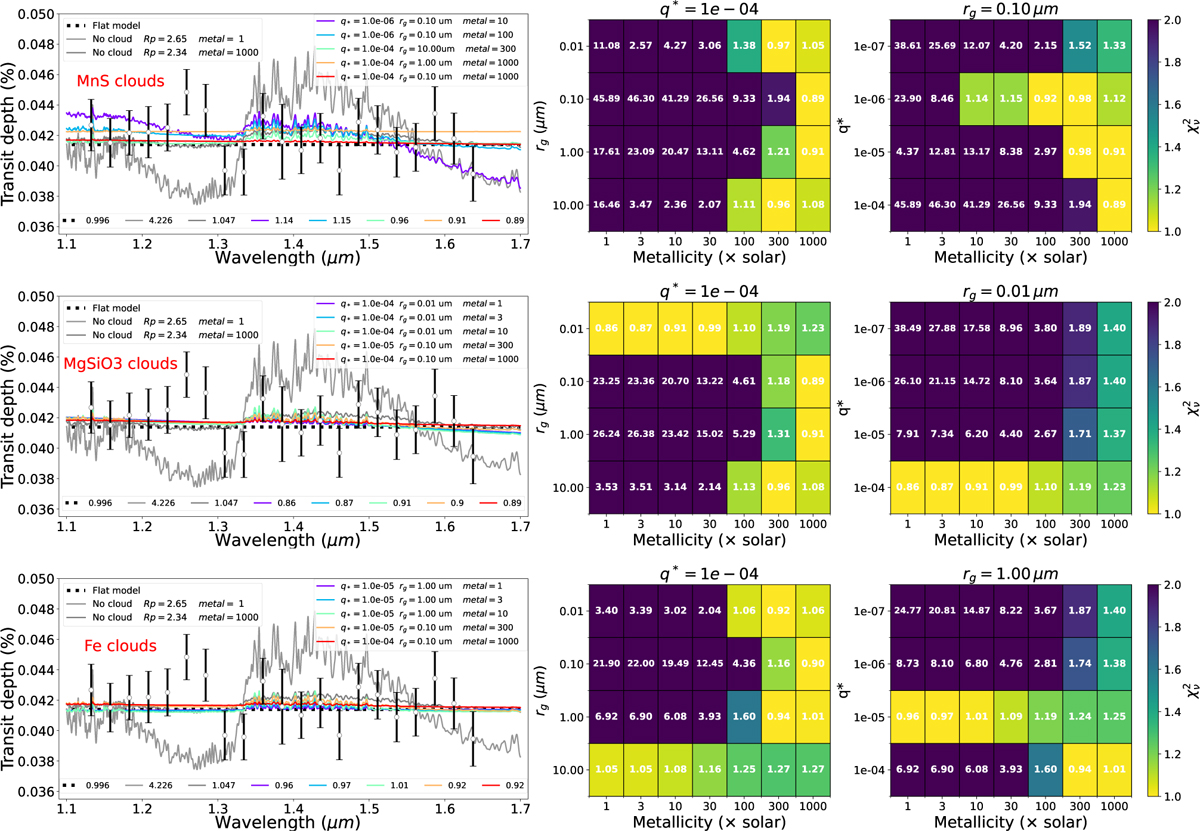
Comparison between different grid models and the goodness of fit for the MnS (top row), MgSiO3 (middle row), and Fe (bottom row) clouds calculated at the planetary radius set to 2.313 R⊕. For each species, the left panel shows our observations with uncertainties compared against some selected lowest reduced chi-squared (![]() ) models, with the corresponding
) models, with the corresponding ![]() values in the bottom legend. The parameter values for clear, no-cloud models are given in the left legend, and for cloudy models, they are given in the right legend. The flat model is drawn as a dotted line at a transit depth of 418 ppm. The tables in the middle and right panels display the models’
values in the bottom legend. The parameter values for clear, no-cloud models are given in the left legend, and for cloudy models, they are given in the right legend. The flat model is drawn as a dotted line at a transit depth of 418 ppm. The tables in the middle and right panels display the models’ ![]() values on a grid of cloud droplet radius rg, droplet volume mixing ratio q*, and metallicity [M/H]. The table titles list fixed parameters. The color bar extent is set between 1 and 2 to highlight only the models that best fit the data.
values on a grid of cloud droplet radius rg, droplet volume mixing ratio q*, and metallicity [M/H]. The table titles list fixed parameters. The color bar extent is set between 1 and 2 to highlight only the models that best fit the data.
Current usage metrics show cumulative count of Article Views (full-text article views including HTML views, PDF and ePub downloads, according to the available data) and Abstracts Views on Vision4Press platform.
Data correspond to usage on the plateform after 2015. The current usage metrics is available 48-96 hours after online publication and is updated daily on week days.
Initial download of the metrics may take a while.