Fig. 4.
Download original image
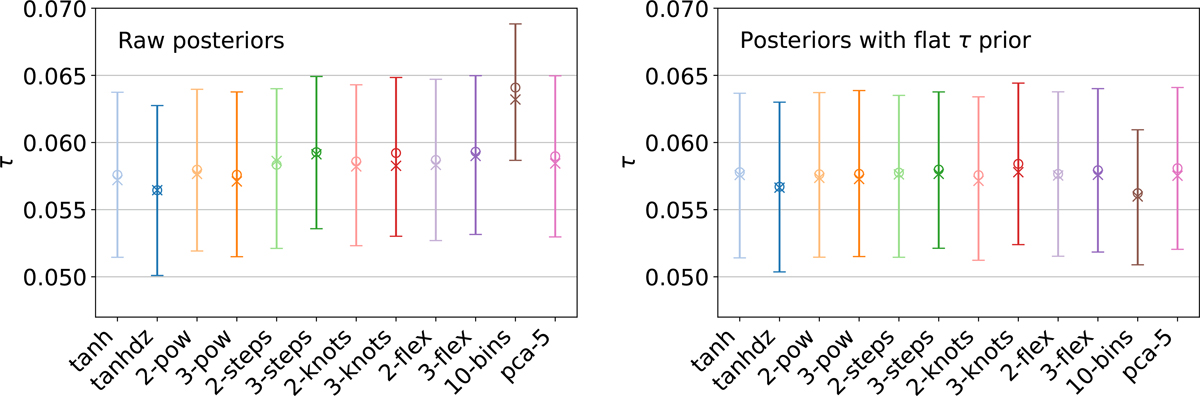
Constraints on the reionisation optical depth from Planck PR4 for the reionisation models considered. The plotted segments represent the 68% credible intervals, where the crosses and circles mark, respectively, the maximum and mean of each posterior. The left panel shows the raw posterior results, while the right panel includes the prior-flattening correction described in Sect. 3.3.
Current usage metrics show cumulative count of Article Views (full-text article views including HTML views, PDF and ePub downloads, according to the available data) and Abstracts Views on Vision4Press platform.
Data correspond to usage on the plateform after 2015. The current usage metrics is available 48-96 hours after online publication and is updated daily on week days.
Initial download of the metrics may take a while.