Open Access
Fig. 3.
Download original image
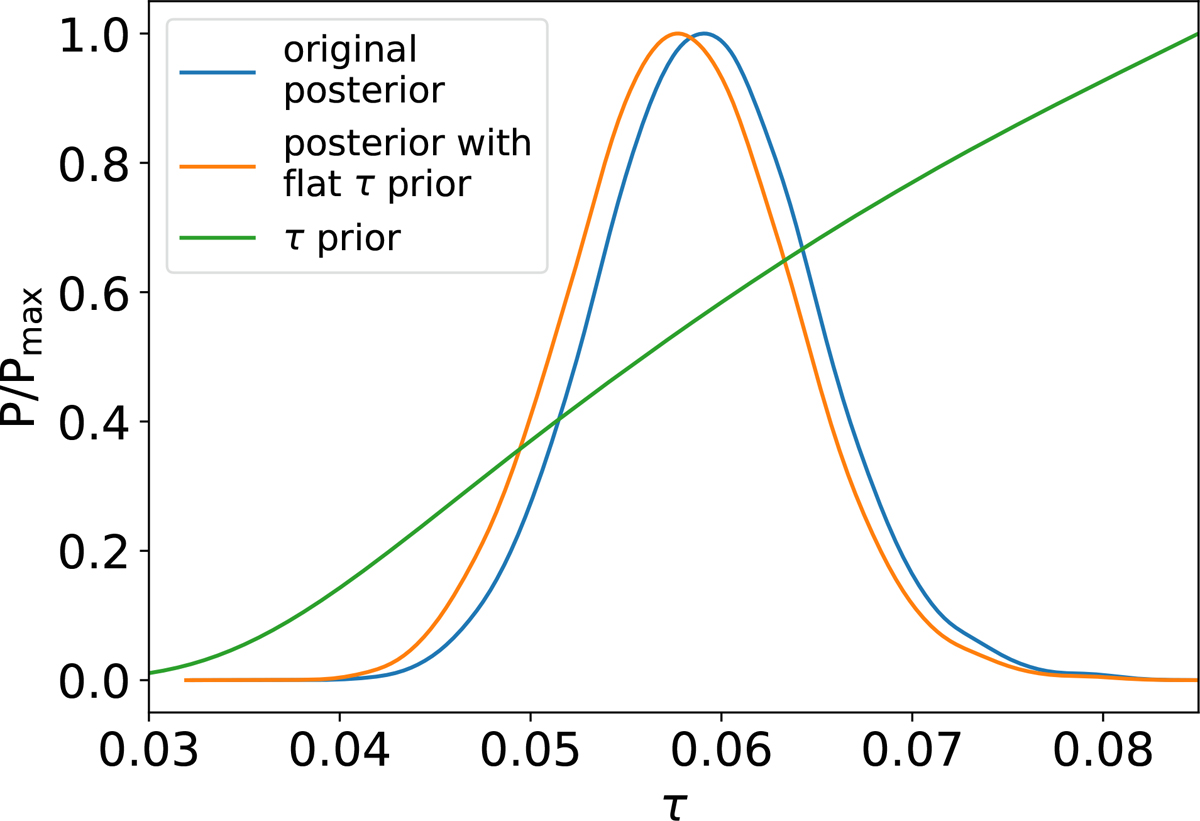
Illustration of the flattening process of the τ prior distribution, applied to the 3-steps reionisation model. The original posterior on τ is shown in blue, while the posterior after flattening and the τ prior are shown, respectively, in orange and green.
Current usage metrics show cumulative count of Article Views (full-text article views including HTML views, PDF and ePub downloads, according to the available data) and Abstracts Views on Vision4Press platform.
Data correspond to usage on the plateform after 2015. The current usage metrics is available 48-96 hours after online publication and is updated daily on week days.
Initial download of the metrics may take a while.