Fig. 2.
Download original image
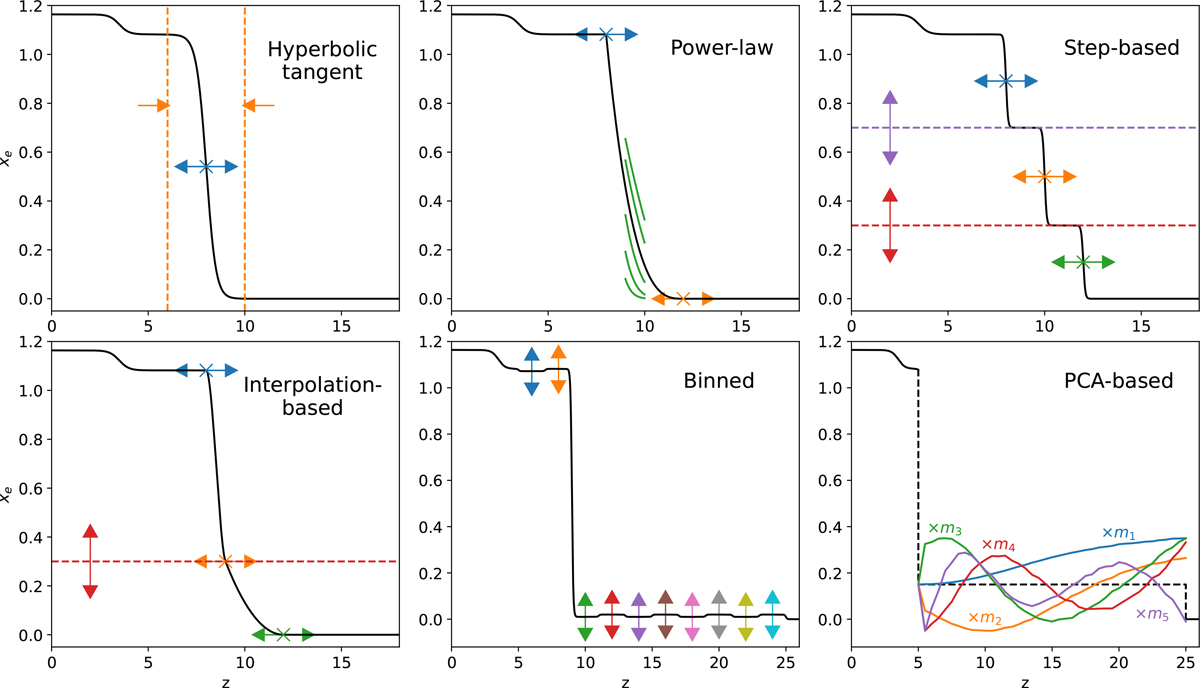
Graphical summary of the reionisation models considered in the present study, illustrating with coloured arrows and lines their respective degrees of freedom in modelling the history of the ionising fraction. The models are grouped by their general approach: hyperbolic tangents, power-laws, step functions, interpolations, bins, and PCA. The models are described in detail in Sect. 2.
Current usage metrics show cumulative count of Article Views (full-text article views including HTML views, PDF and ePub downloads, according to the available data) and Abstracts Views on Vision4Press platform.
Data correspond to usage on the plateform after 2015. The current usage metrics is available 48-96 hours after online publication and is updated daily on week days.
Initial download of the metrics may take a while.