Fig. 8.
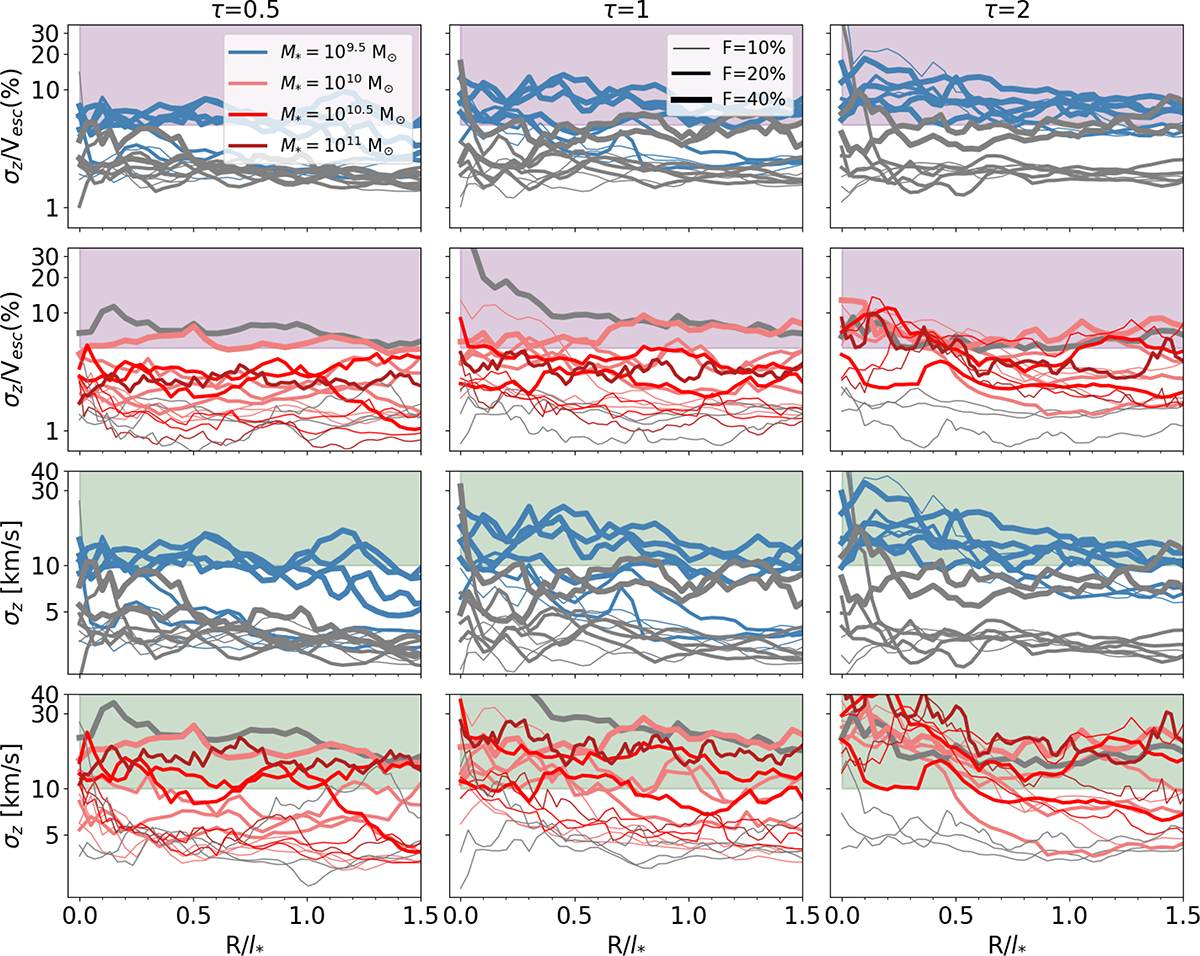
Download original image
Evolution (from left to right) of the vertical velocity dispersion σz (two bottom rows) and σz normalised by the local escape velocity (two top rows). The blue (resp. red) curves represent models with an initial stellar mass of 109.5 M⊙ (resp. above or equal to 1010 M⊙, see inset in top left panel). The grey lines are models that do not display a bar at the end of the simulation. The line thickness corresponds to the gas fraction (see inset in the top middle panel). The green shaded areas show vertical velocity dispersions ranging from 10 to 40 km s−1 and the purple shaded areas show a percentage above 5%.
Current usage metrics show cumulative count of Article Views (full-text article views including HTML views, PDF and ePub downloads, according to the available data) and Abstracts Views on Vision4Press platform.
Data correspond to usage on the plateform after 2015. The current usage metrics is available 48-96 hours after online publication and is updated daily on week days.
Initial download of the metrics may take a while.