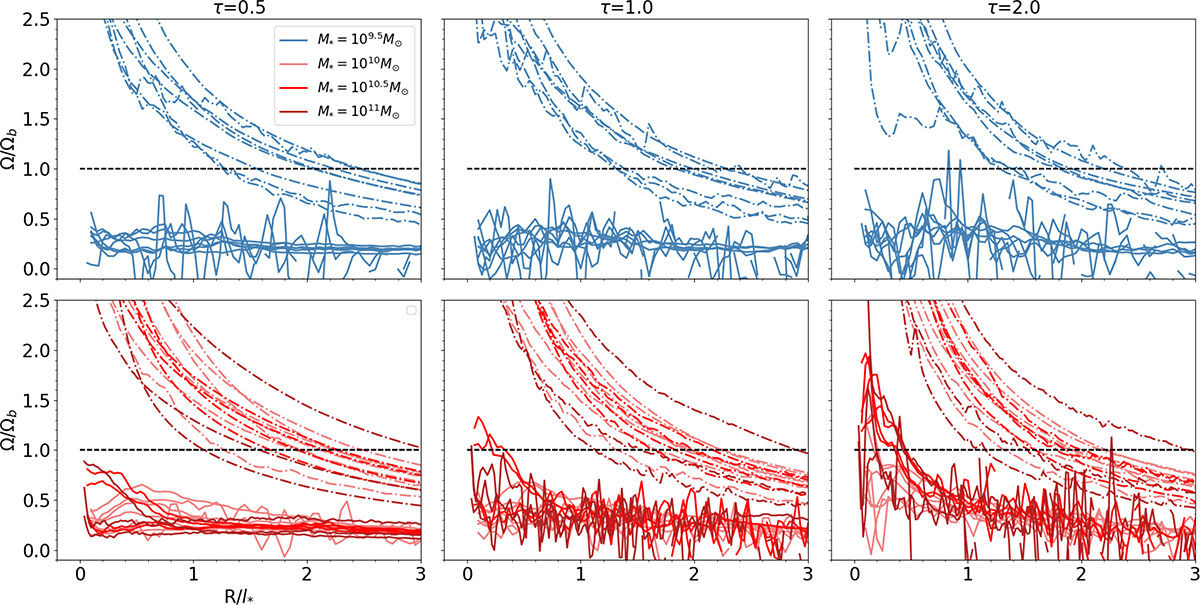
Fig. 4.
Download original image
Evolution over time (from left to right, τ = 0.5, 1, and 2) of the normalised angular frequency Ω (dot-dashed lines) and Ω − κ/2 (solid curves) radial profiles of the barred low stellar mass (blue curves, top row) and high stellar mass (red curves, bottom row) models. The quantity used in the normalisation is the bar pattern speed Ωb. The horizontal black dashed line represents Ω = Ωb.
Current usage metrics show cumulative count of Article Views (full-text article views including HTML views, PDF and ePub downloads, according to the available data) and Abstracts Views on Vision4Press platform.
Data correspond to usage on the plateform after 2015. The current usage metrics is available 48-96 hours after online publication and is updated daily on week days.
Initial download of the metrics may take a while.