Fig. 3.
Download original image
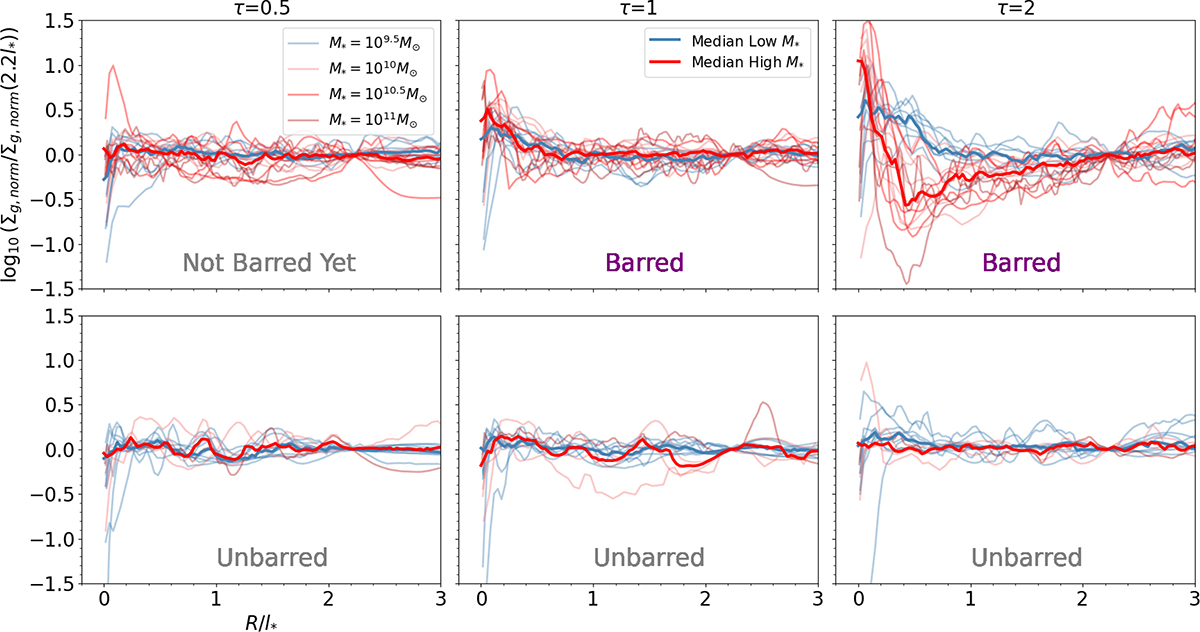
Normalised surface gas density profiles Σg, norm(τ, R) for our set of simulations at τ = 0.5, 1, and 2 (see text; Σg, norm(τ, R) = Σg/Σg(τ = 0, R)). All Σg, norm profiles have been divided by the value of Σg, norm at R = 2.2 ⋅ l*, for legibility. Each thin blue curve represents a low stellar mass model (< 1010 M⊙) and each thin red curve corresponds to a higher stellar mass model (≥ 1010 M⊙; see inset in the top left panel). The thick blue (resp. red) line in each panel is the associated median of the thin blue (resp. red) curve. The top panels show models that have formed a bar, sustained until the end of the simulation. The bottom panels illustrate the unbarred models (which are mostly those with large initial spheroids, e.g. G015 and G032, or extended initial discs, e.g. G043; see Appendix A).
Current usage metrics show cumulative count of Article Views (full-text article views including HTML views, PDF and ePub downloads, according to the available data) and Abstracts Views on Vision4Press platform.
Data correspond to usage on the plateform after 2015. The current usage metrics is available 48-96 hours after online publication and is updated daily on week days.
Initial download of the metrics may take a while.