Fig. 12.
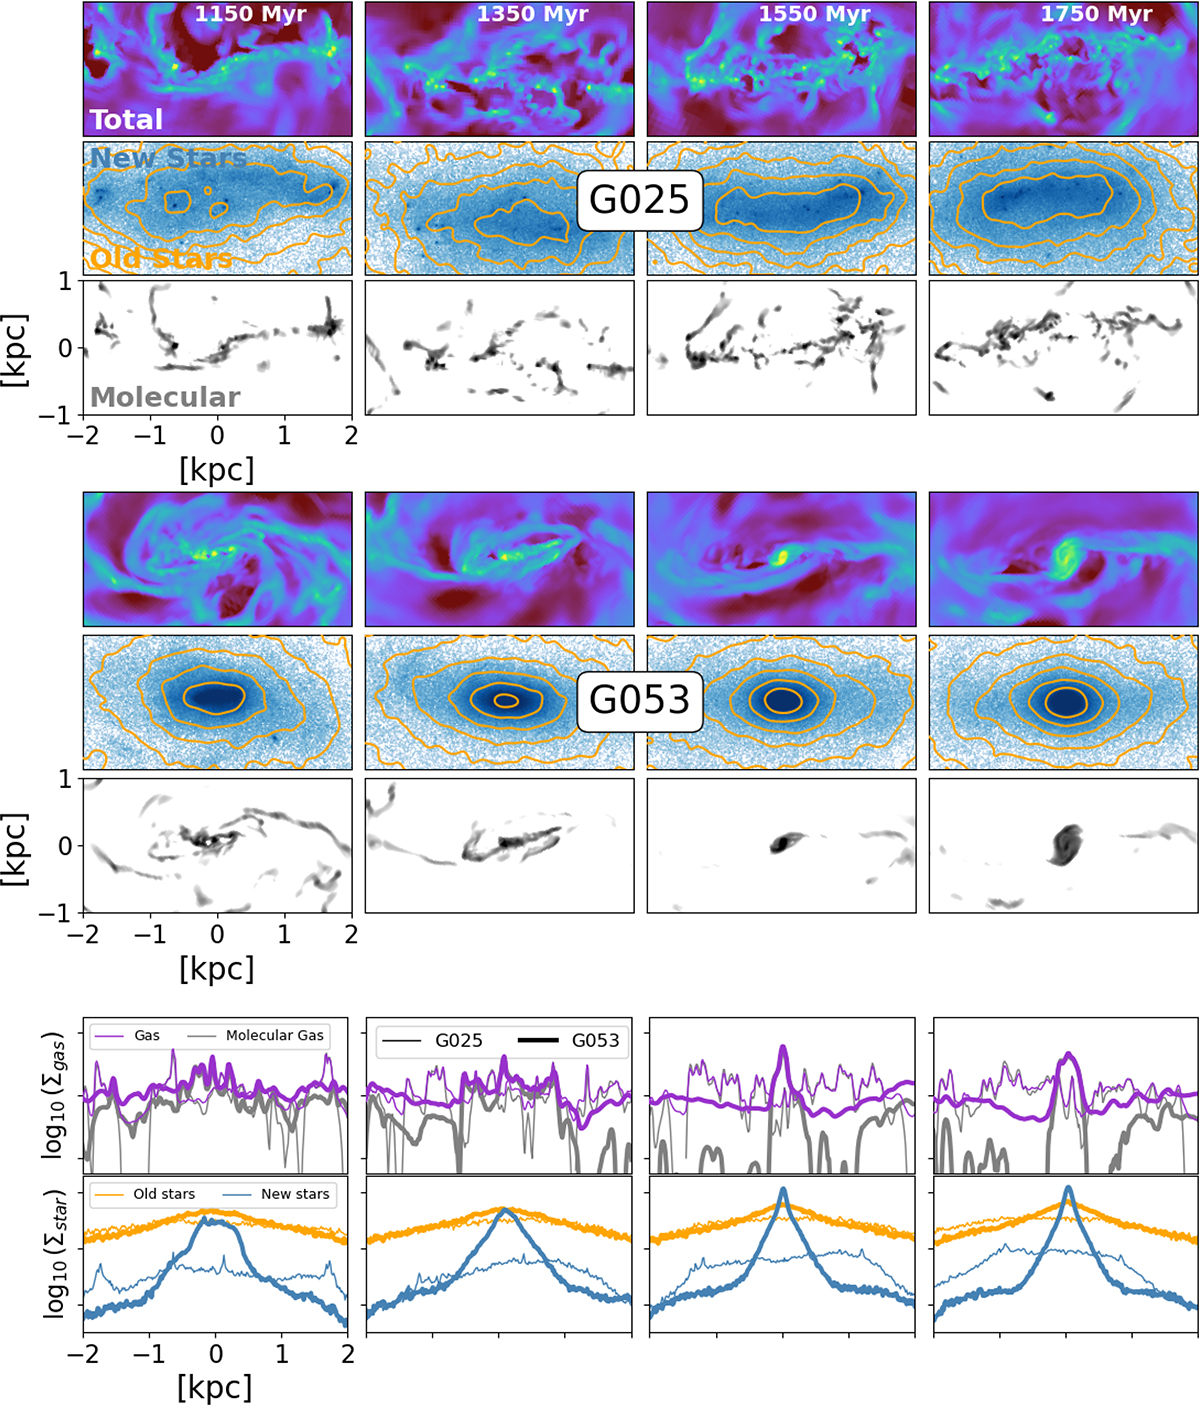
Download original image
Time evolution of simulations G025 and G053, a low and intermediate stellar mass system (109.5 and 1010 M⊙, respectively) in the central 2 kpc. Four running times are presented (from left to right, first six panels from top), with steps of 200 Myr, with a seed gas reservoir forming in G053 around t = 1400 Myr (between the two middle panels). Maps with a field of view of 2 kpc × 1 kpc of the total gas surface density, the mass of new stars (and old stars, as orange contours) and molecular gas density are shown as maps in the first to third rows for G025, and fourth to sixth rows for G053. In all maps, the bar is aligned with the x-axis. The two bottom rows show the radial profiles, averaged over the y-axis (±1 kpc), first with the gas profiles (total and molecular), and then the stellar density profiles (bottom row; old and new stars).
Current usage metrics show cumulative count of Article Views (full-text article views including HTML views, PDF and ePub downloads, according to the available data) and Abstracts Views on Vision4Press platform.
Data correspond to usage on the plateform after 2015. The current usage metrics is available 48-96 hours after online publication and is updated daily on week days.
Initial download of the metrics may take a while.