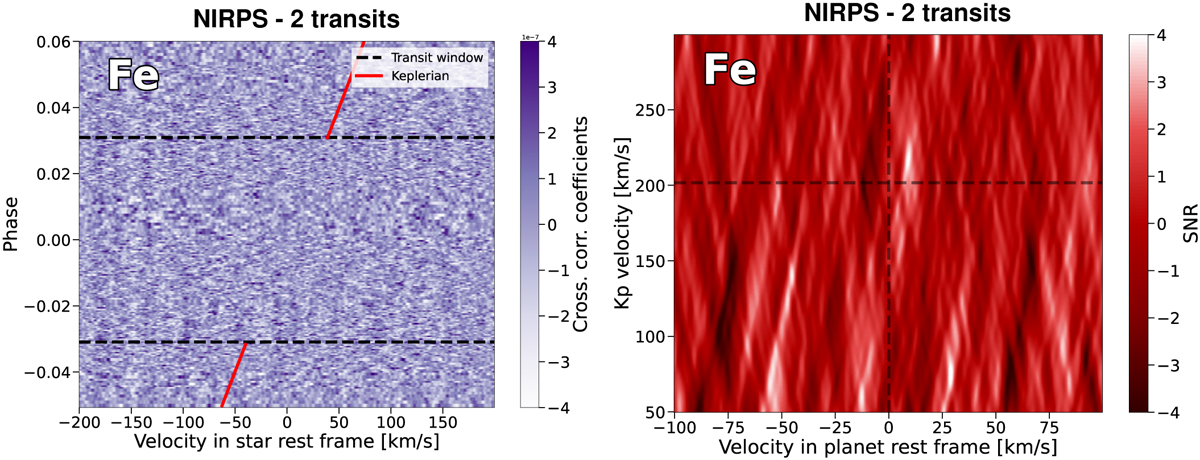
Fig. 8
Download original image
Cross-correlation trail map (left panel) and Kp–vsys map (right panel) of NIRPS data, obtained with the reduction pipeline described in Section 4. Black dashed lines (right panel) denote the expected Kp determined from Prinoth et al. (2023), and vsys=0 km s−1. The colourmaps show a non-detection of Fe from two transits of WASP-189b observed with the NIRPS spectrograph. The observation gap occurred during the first transit on the night of 2023-04-24 is visible as a banded structure of higher scatter between phases 0.0 and 0.02 (left panel).
Current usage metrics show cumulative count of Article Views (full-text article views including HTML views, PDF and ePub downloads, according to the available data) and Abstracts Views on Vision4Press platform.
Data correspond to usage on the plateform after 2015. The current usage metrics is available 48-96 hours after online publication and is updated daily on week days.
Initial download of the metrics may take a while.