Fig. 7
Download original image
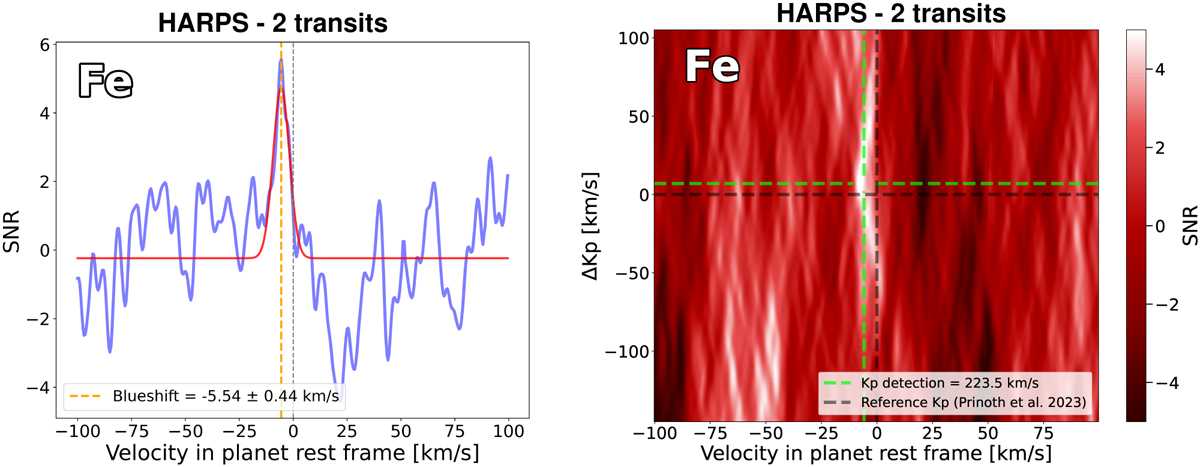
Left panel: maximum S/N versus velocities at the measured Kp (blue curve). In red, the best-fit Gaussian to the Fe cross-correlation peak, whose centroid results blueshifted by −5.54 ± 0.44 km/s with respect to zero km/s. The positive peaks around ~40 km s−1, ~−60 km s−1, and the negative peak at ~−20 km s−1 are artefacts of the Rossiter-McLaughlin correction and not statistical fluctuations. Right panel: ΔKp−vsys diagram. The ΔKp is calculated as ΔKp = Kp − Kp,measured (Wardenier et al. 2023). The black dashed lines denote the expected vsys and Kp from Prinoth et al. (2023) (i.e. Kp = 200.7 km s−1). Features around +50 and −50 km/s are residuals of the Rossiter-McLaughlin correction fitting and not due statistical fluctuations (Section 4.3.1).
Current usage metrics show cumulative count of Article Views (full-text article views including HTML views, PDF and ePub downloads, according to the available data) and Abstracts Views on Vision4Press platform.
Data correspond to usage on the plateform after 2015. The current usage metrics is available 48-96 hours after online publication and is updated daily on week days.
Initial download of the metrics may take a while.