Fig. 6
Download original image
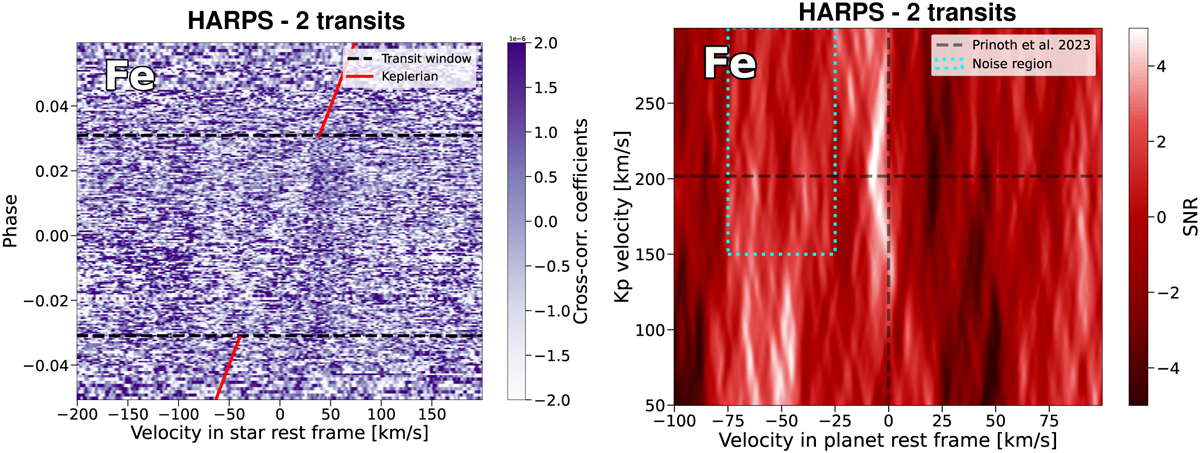
Neutral Fe cross-correlation from two transits of WASP-189b observed with the HARPS spectrograph. Left panel: cross-correlation time series corrected for the Rossiter–McLauglin contribution. The planetary trail follows the Keplerian motion in red, and it is bound within the transit window (first and fourth contact transit phases indicated by horizontal black dashed line). Right panel: Kp−vsys diagram. The black dashed lines denote the expected vsys and Kp from Prinoth et al. (2023). The region enclosed in the cyan dotted box is used for the calculation of the S/N used throughout the entire map. Features around +50 and −50 km/s are residuals of the Rossiter-McLaughlin correction fitting and not due statistical fluctuations (Section 4.3.1).
Current usage metrics show cumulative count of Article Views (full-text article views including HTML views, PDF and ePub downloads, according to the available data) and Abstracts Views on Vision4Press platform.
Data correspond to usage on the plateform after 2015. The current usage metrics is available 48-96 hours after online publication and is updated daily on week days.
Initial download of the metrics may take a while.