Fig. I.1
Download original image
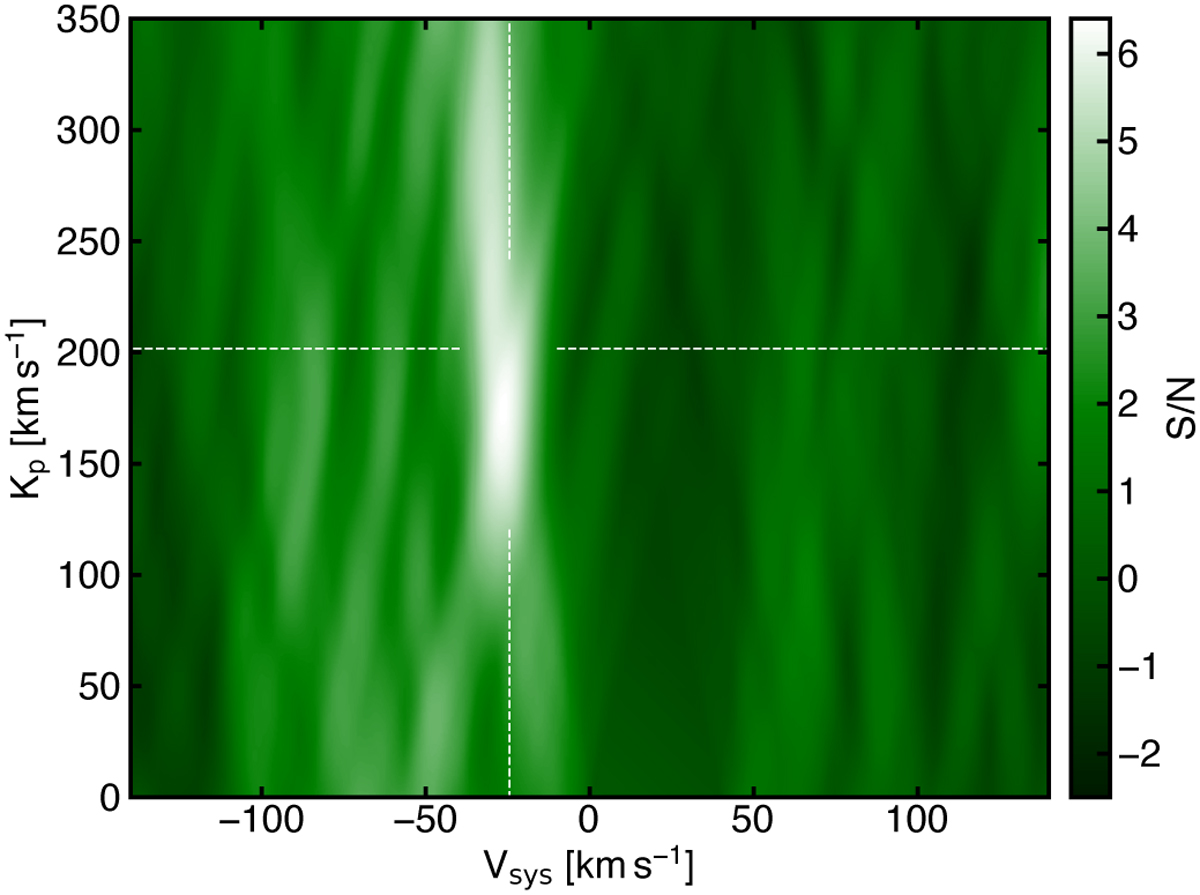
Cross-correlation detection of Fe from the HARPS transits, but now using a blind data-driven PCA-based detrending algorithm instead. The white dashed lines denote the expected Kp and vsys (Kp=200.7 km s−1 and vsys=−24.45 km s−1; Prinoth et al. 2022; Anderson et al. 2018) of WASP-189b assuming a uniform and static atmosphere. The white blob near the expected location shows the observed signal of WASP-189b. Differently from Figure 6, 7, 8, and, H.1, G.1, this map has been generated from transmission spectra non-shifted by the systemic velocity. The uniformness of the CCF map between 0 and 50 km s−1 at low Kp values is a result of the Rossiter-McLaughlin mask excluding values overlapping with the Doppler shadow in radial velocity space. The data product that produced this CCF map is the input for the atmospheric retrieval analysis (Section 5.3).
Current usage metrics show cumulative count of Article Views (full-text article views including HTML views, PDF and ePub downloads, according to the available data) and Abstracts Views on Vision4Press platform.
Data correspond to usage on the plateform after 2015. The current usage metrics is available 48-96 hours after online publication and is updated daily on week days.
Initial download of the metrics may take a while.