Open Access
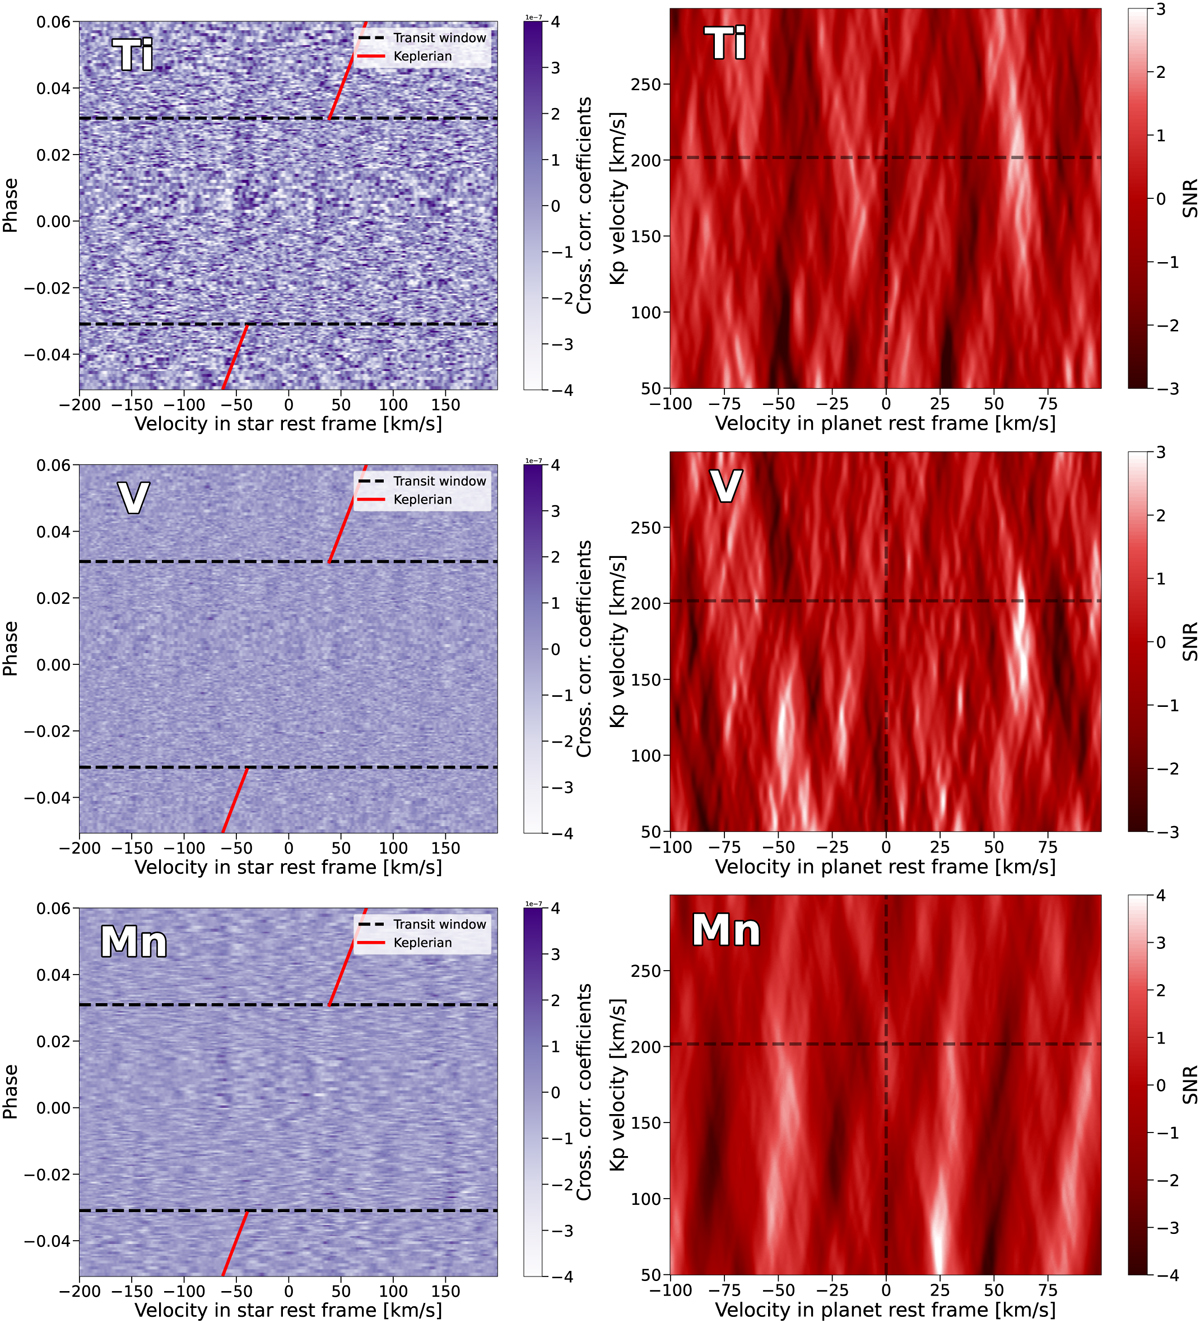
Fig. G.1
Download original image
NIRPS cross-correlation results showing non-detected chemical species. Black dashed lines (right panel) denote the expected Kp determined from Prinoth et al. (2023), and vsys = 0 km s−1. Left column: cross-correlation trail map. Right column: cross-correlation Kp–vsys map.
Current usage metrics show cumulative count of Article Views (full-text article views including HTML views, PDF and ePub downloads, according to the available data) and Abstracts Views on Vision4Press platform.
Data correspond to usage on the plateform after 2015. The current usage metrics is available 48-96 hours after online publication and is updated daily on week days.
Initial download of the metrics may take a while.