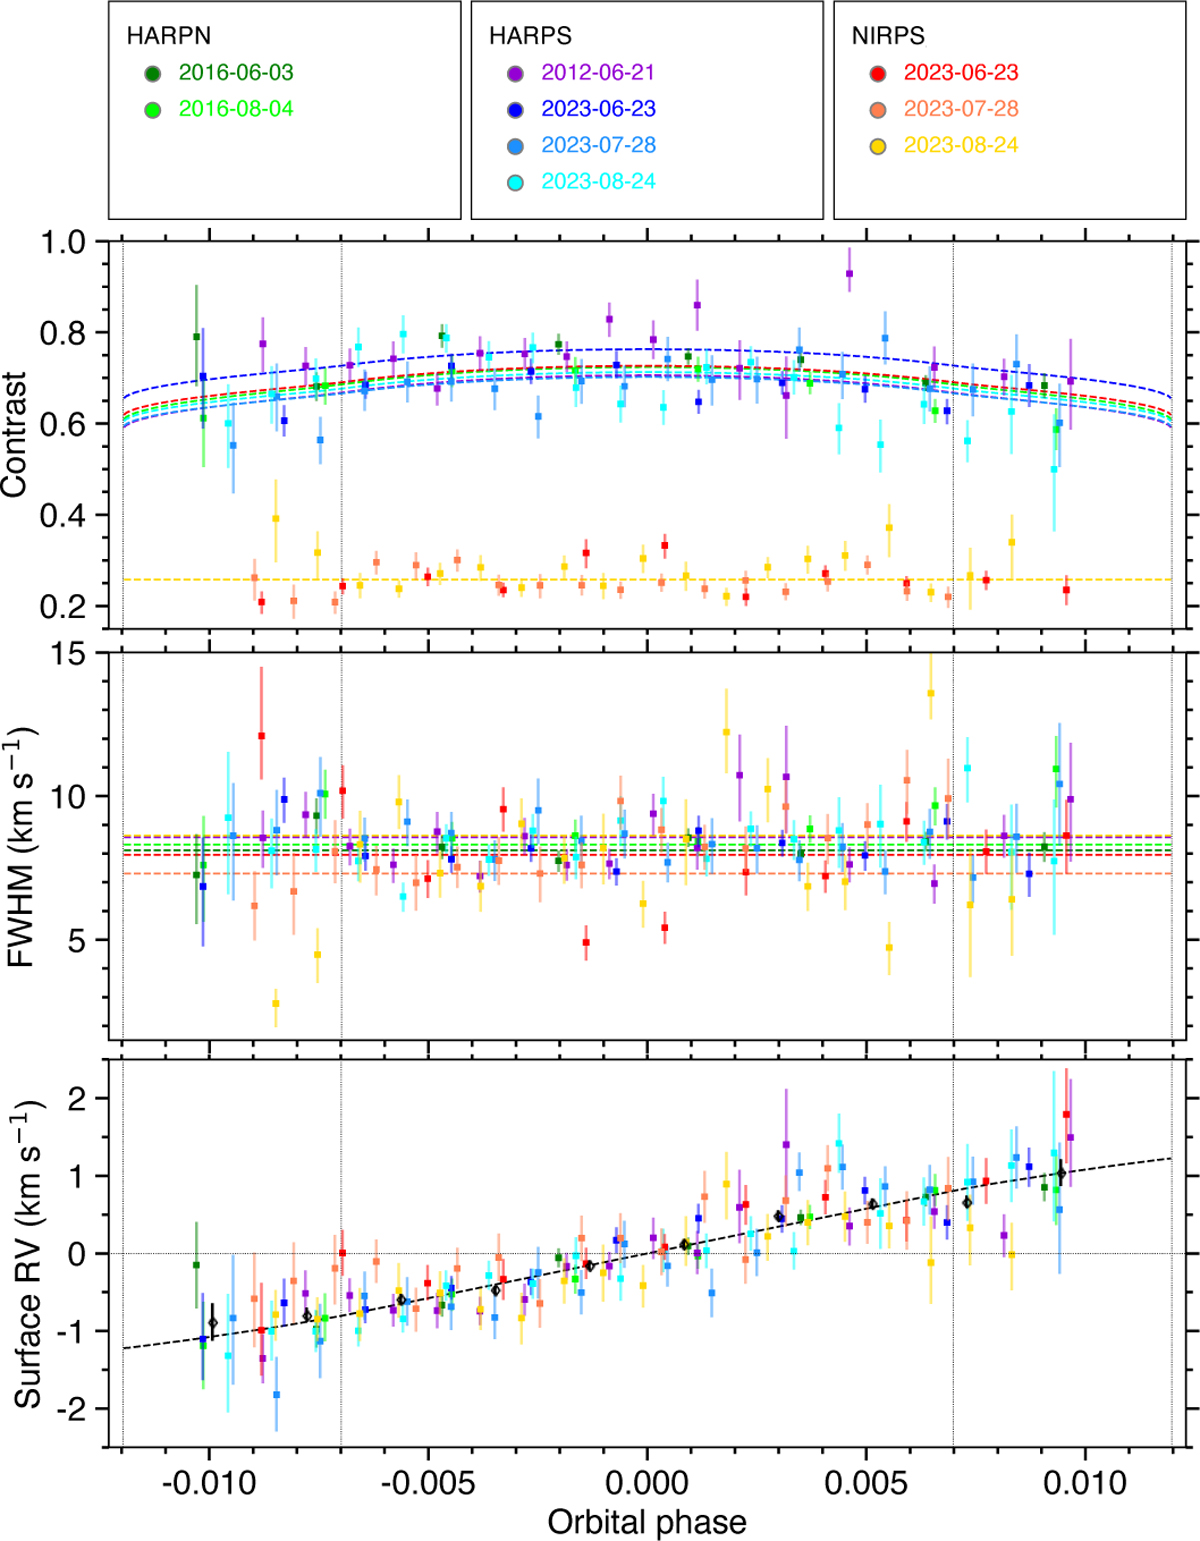
Fig. 4
Download original image
Properties of the WASP-69 intrinsic CCFs along the transit chord. Colored squares correspond to the best fit to the line in individual exposures (same color scheme as in Fig. 2). Dashed-colored curves are the visit-specific contrast and FWHM models associated with the best RMR fit. The dashed black curve is the common surface RV model. Plotted RV measurements have been binned into black circles to highlight the good agreement with the model. Vertical dashed lines indicate the transit contacts.
Current usage metrics show cumulative count of Article Views (full-text article views including HTML views, PDF and ePub downloads, according to the available data) and Abstracts Views on Vision4Press platform.
Data correspond to usage on the plateform after 2015. The current usage metrics is available 48-96 hours after online publication and is updated daily on week days.
Initial download of the metrics may take a while.