Fig. E.1
Download original image
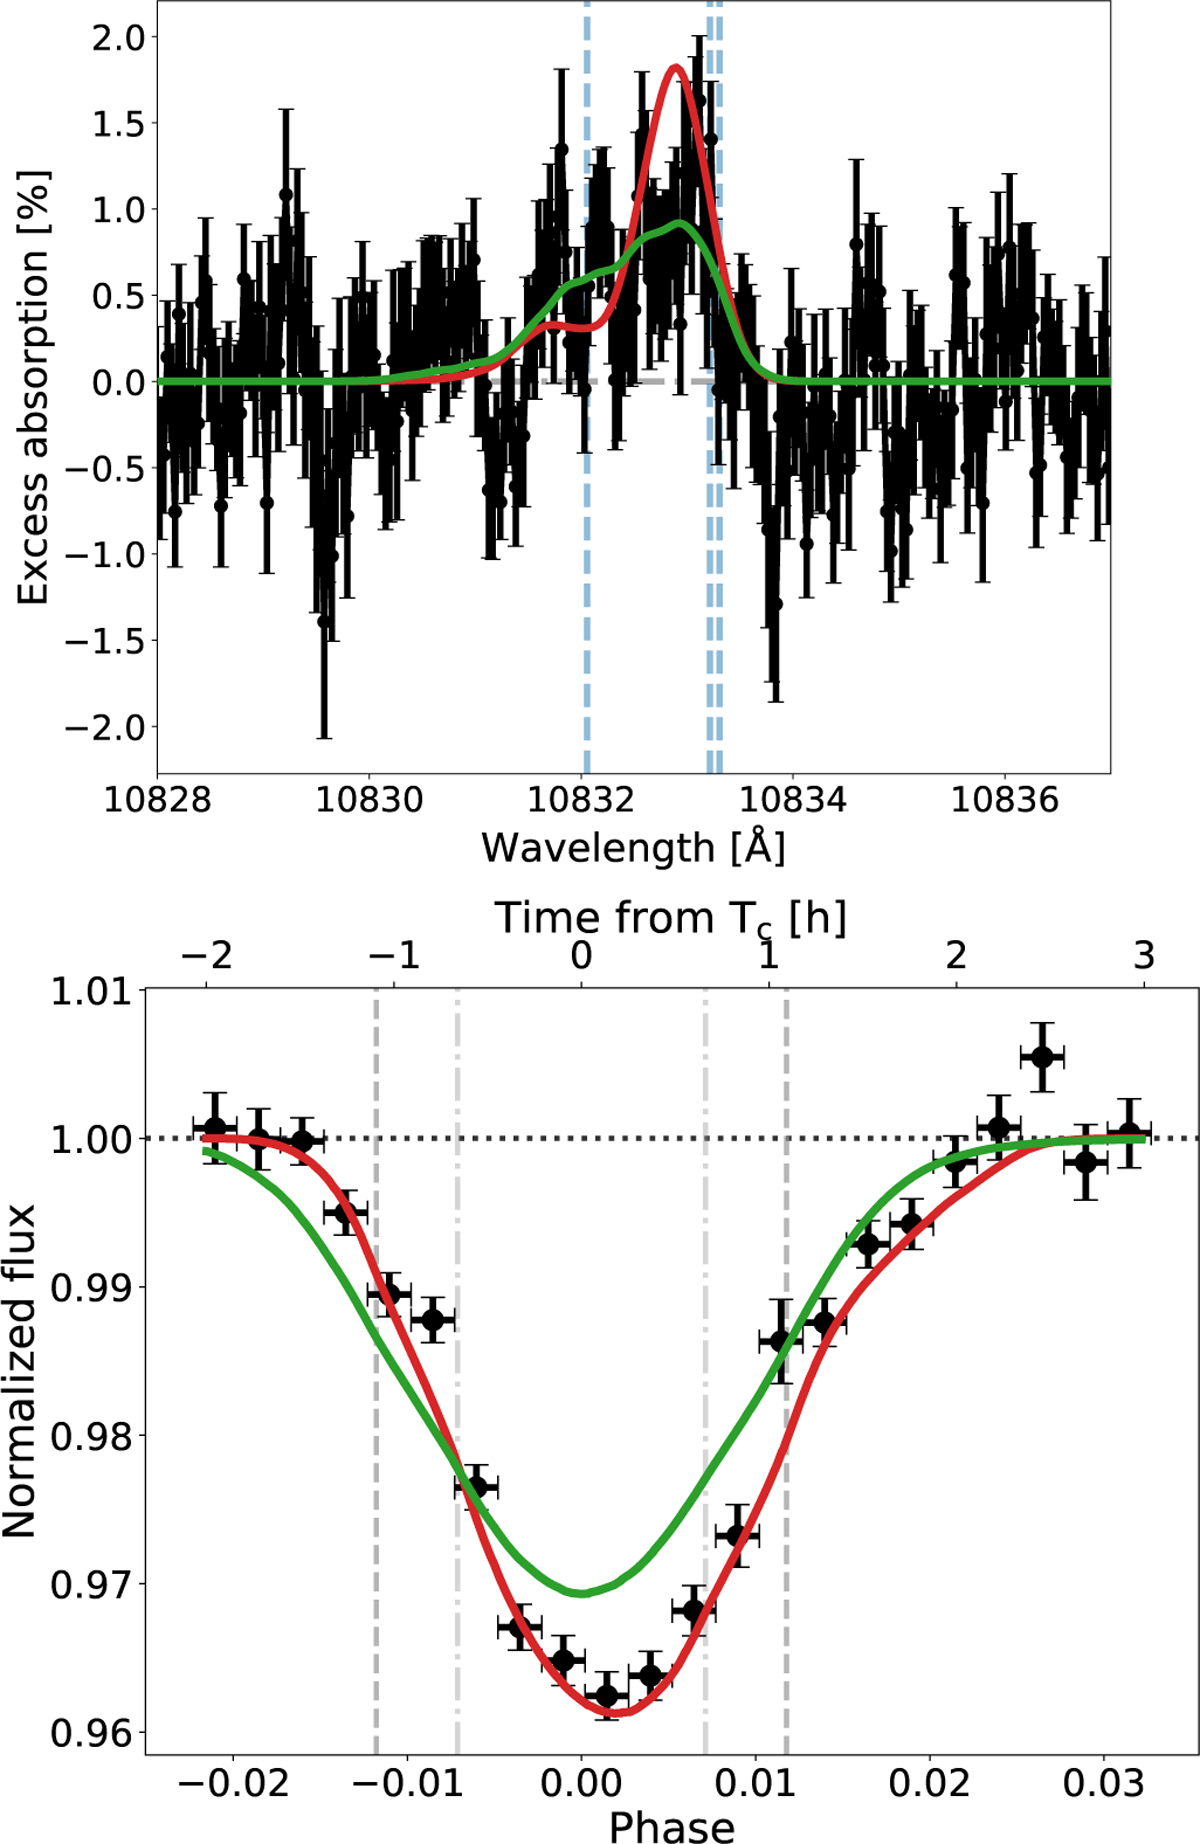
Comparison of the post-transit absorption signal with EVE models including thermosphere and exosphere. In black are the data, in red is the best-fit model over the whole timeseries, and in green is the best-fit model adjusted to the post-transit from t4 to 50 minutes after t4. The top panel shows the transmission spectrum and the bottom panel shows the light curve.
Current usage metrics show cumulative count of Article Views (full-text article views including HTML views, PDF and ePub downloads, according to the available data) and Abstracts Views on Vision4Press platform.
Data correspond to usage on the plateform after 2015. The current usage metrics is available 48-96 hours after online publication and is updated daily on week days.
Initial download of the metrics may take a while.