Fig. 16
Download original image
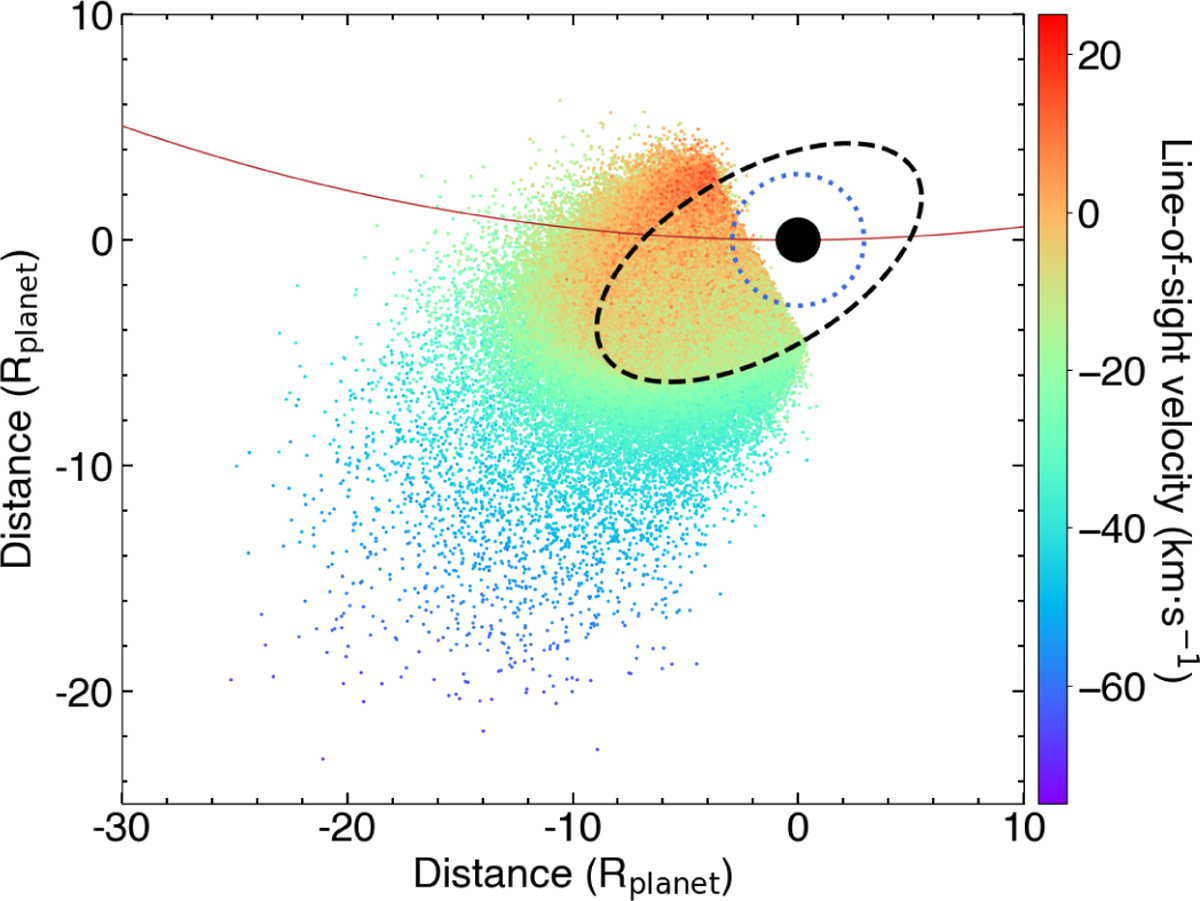
View of the system in the best-fit simulation, including an exosphere, as seen from the perpendicular to the orbital plane at mid-transit. The color bar indicates the line of sight velocity towards the observer in km s−1. The black dashed line corresponds to the exobase and the blue dashed line to the Roche lobe. The cometary tail extends out to 17 times the planetary radius.
Current usage metrics show cumulative count of Article Views (full-text article views including HTML views, PDF and ePub downloads, according to the available data) and Abstracts Views on Vision4Press platform.
Data correspond to usage on the plateform after 2015. The current usage metrics is available 48-96 hours after online publication and is updated daily on week days.
Initial download of the metrics may take a while.