Fig. 15
Download original image
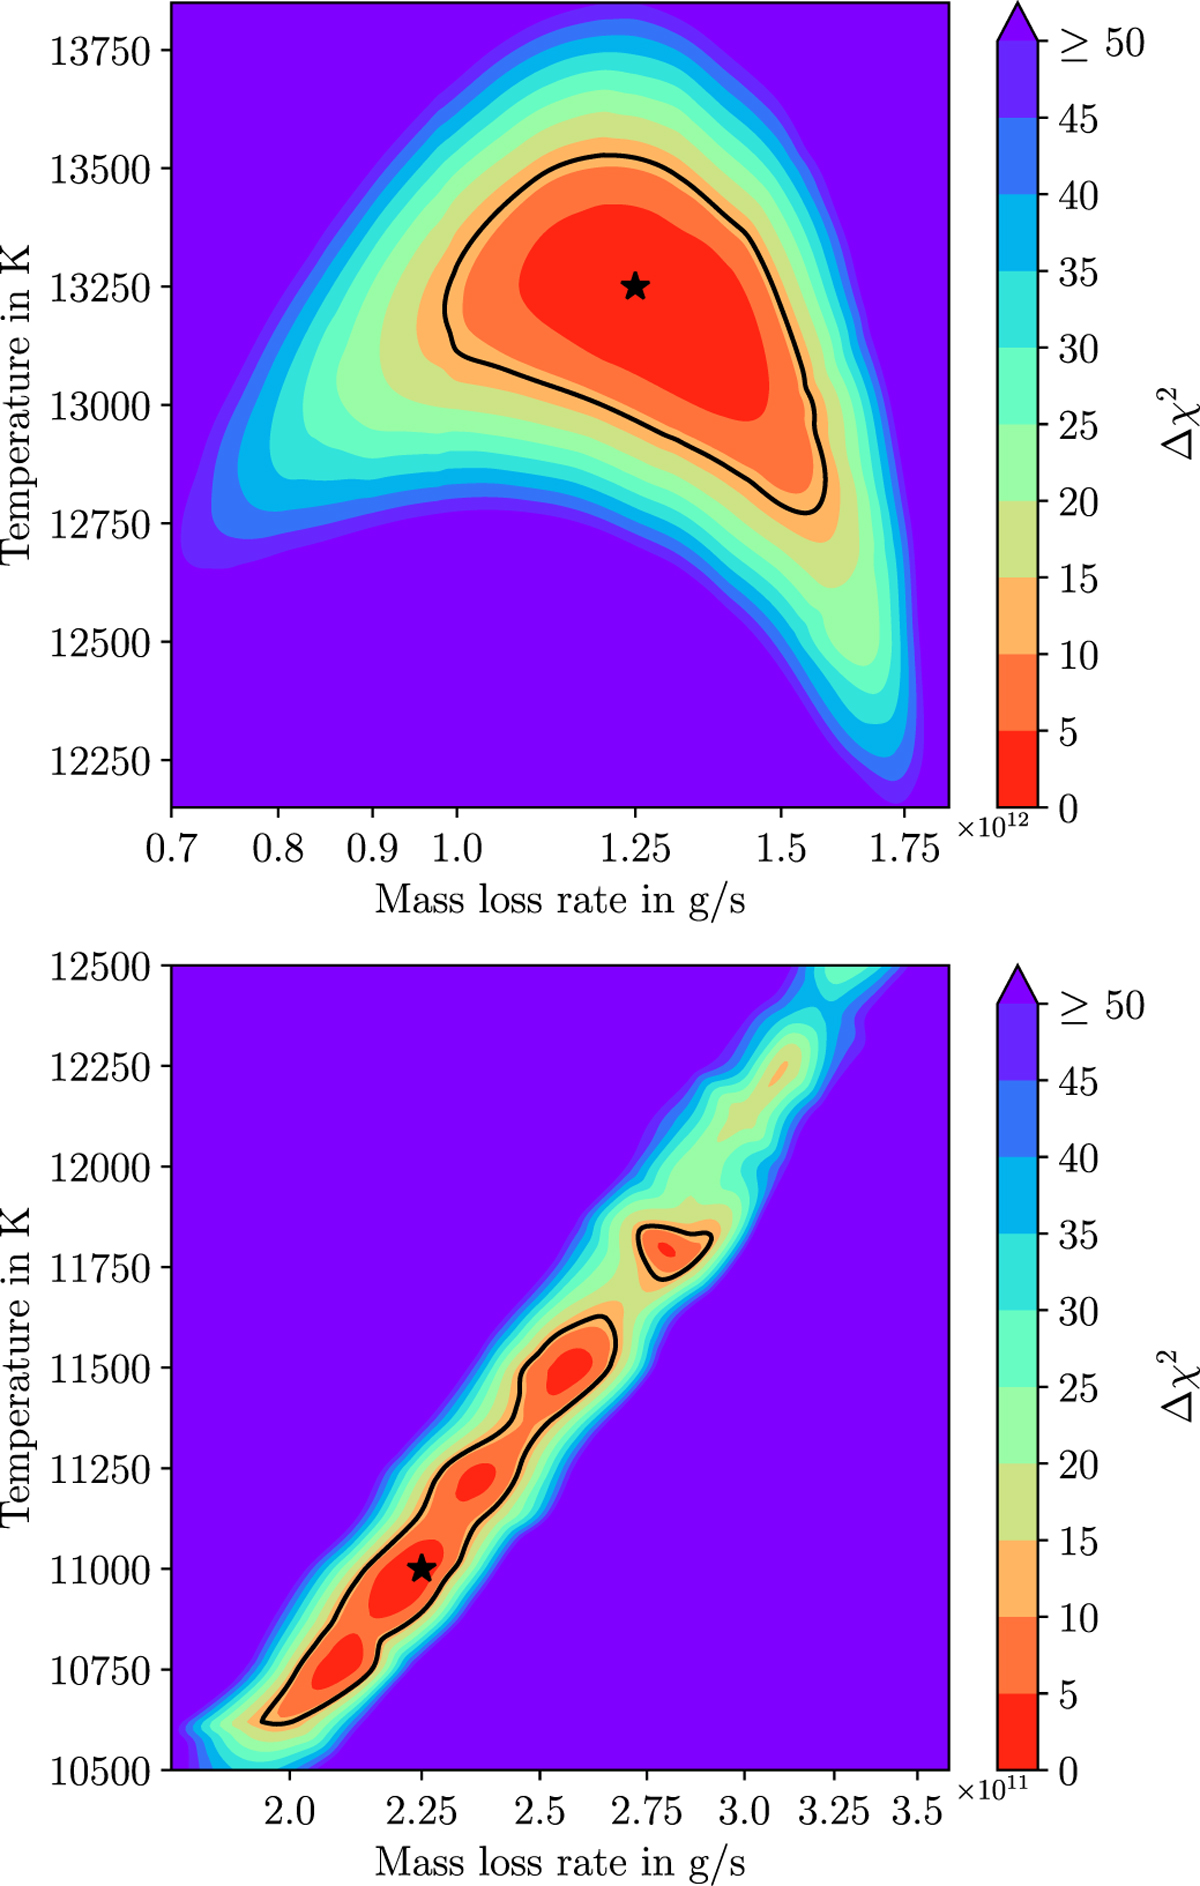
χ2 maps of the EVE simulations. The maps are colored as a function of the difference between the projected minimum value of χ2 along the other parameters in the plane temperature-mass loss and the overall minimum χ2 corresponding to the best simulations (shown as black stars). The black line indicates the 3 σ level in both panels. Top panel: models with thermosphere only (see Section 6.3.2), the H/He ratio varied between 0.8 and 0.9. Bottom panel: models with thermosphere and exosphere (see Section 6.3.3), where the H/He ratio is fixed to 0.8.
Current usage metrics show cumulative count of Article Views (full-text article views including HTML views, PDF and ePub downloads, according to the available data) and Abstracts Views on Vision4Press platform.
Data correspond to usage on the plateform after 2015. The current usage metrics is available 48-96 hours after online publication and is updated daily on week days.
Initial download of the metrics may take a while.