Open Access
Fig. 12
Download original image
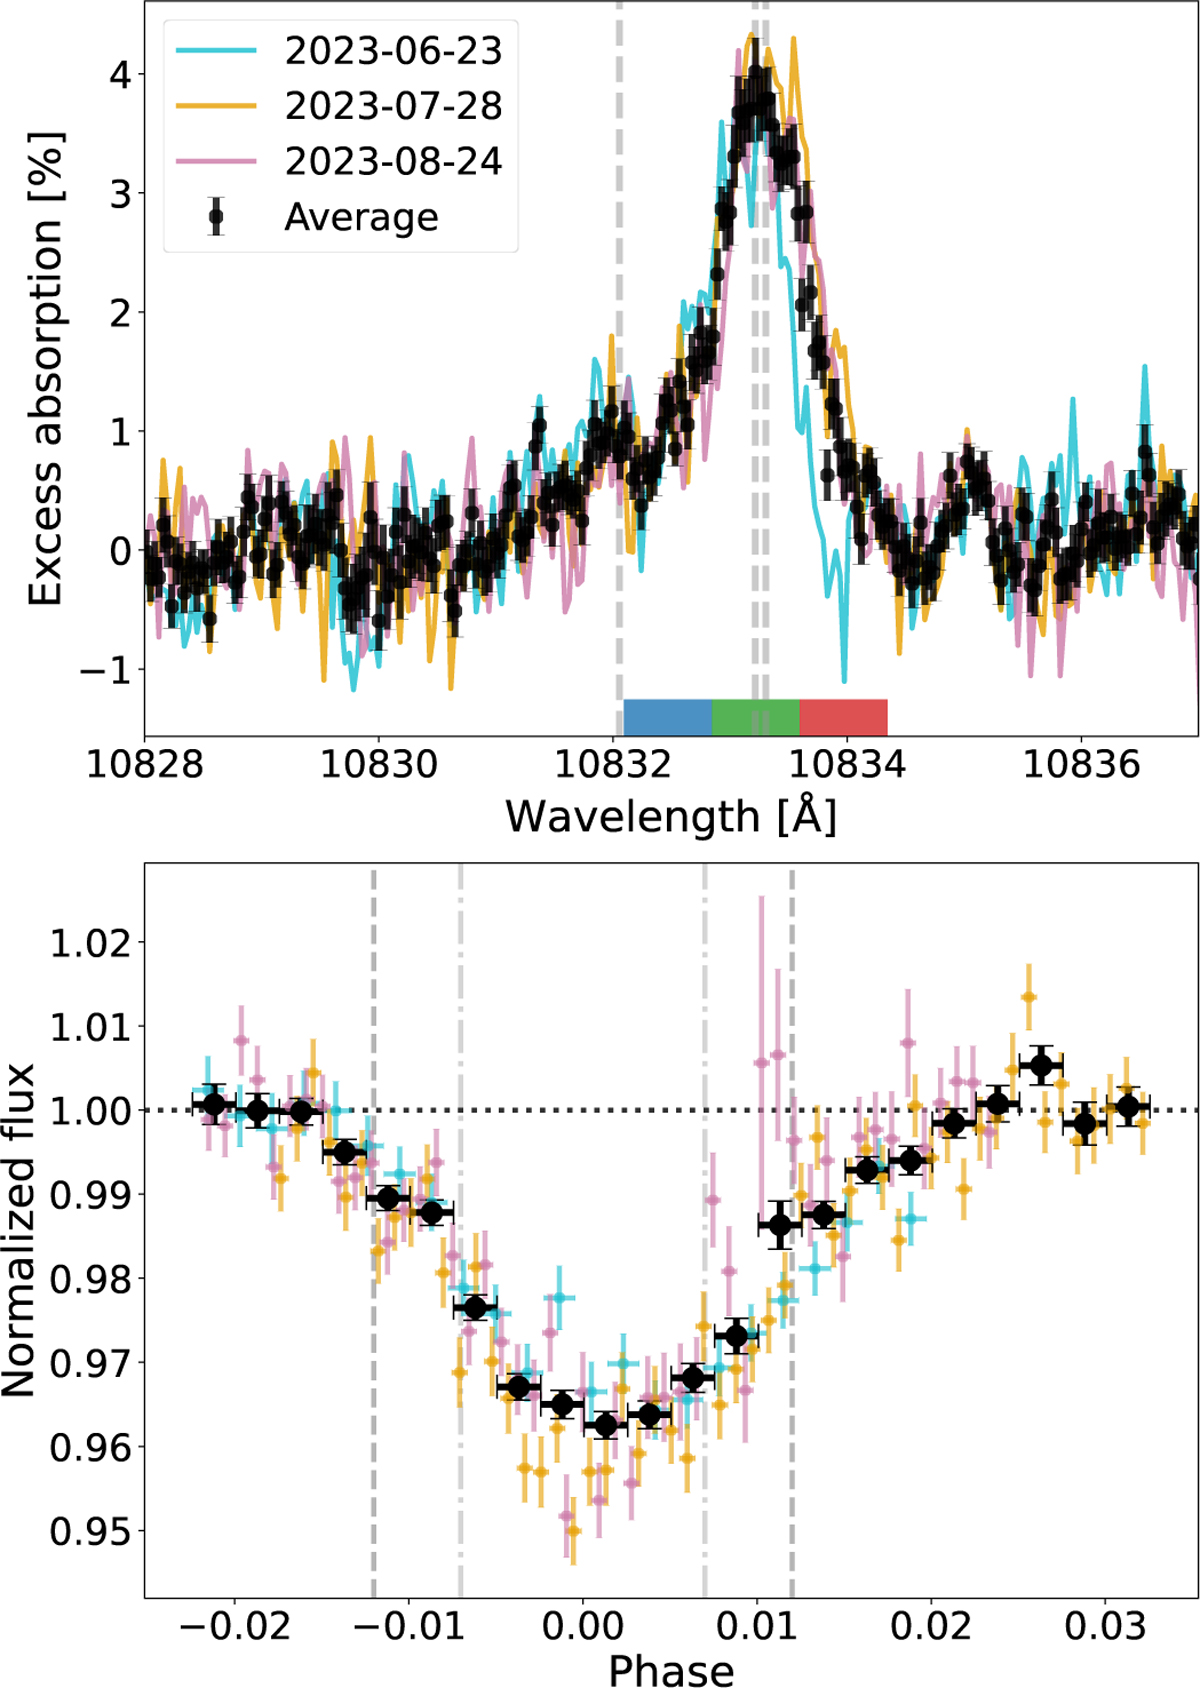
Transmission spectra (top) and excess helium light curves (bottom) comparison between transits (in cyan, orange, and pink) and the average in black. On the top panel, three spectral regions (blue, green, and red) are identified to measure the temporal variation of the helium signature.
Current usage metrics show cumulative count of Article Views (full-text article views including HTML views, PDF and ePub downloads, according to the available data) and Abstracts Views on Vision4Press platform.
Data correspond to usage on the plateform after 2015. The current usage metrics is available 48-96 hours after online publication and is updated daily on week days.
Initial download of the metrics may take a while.