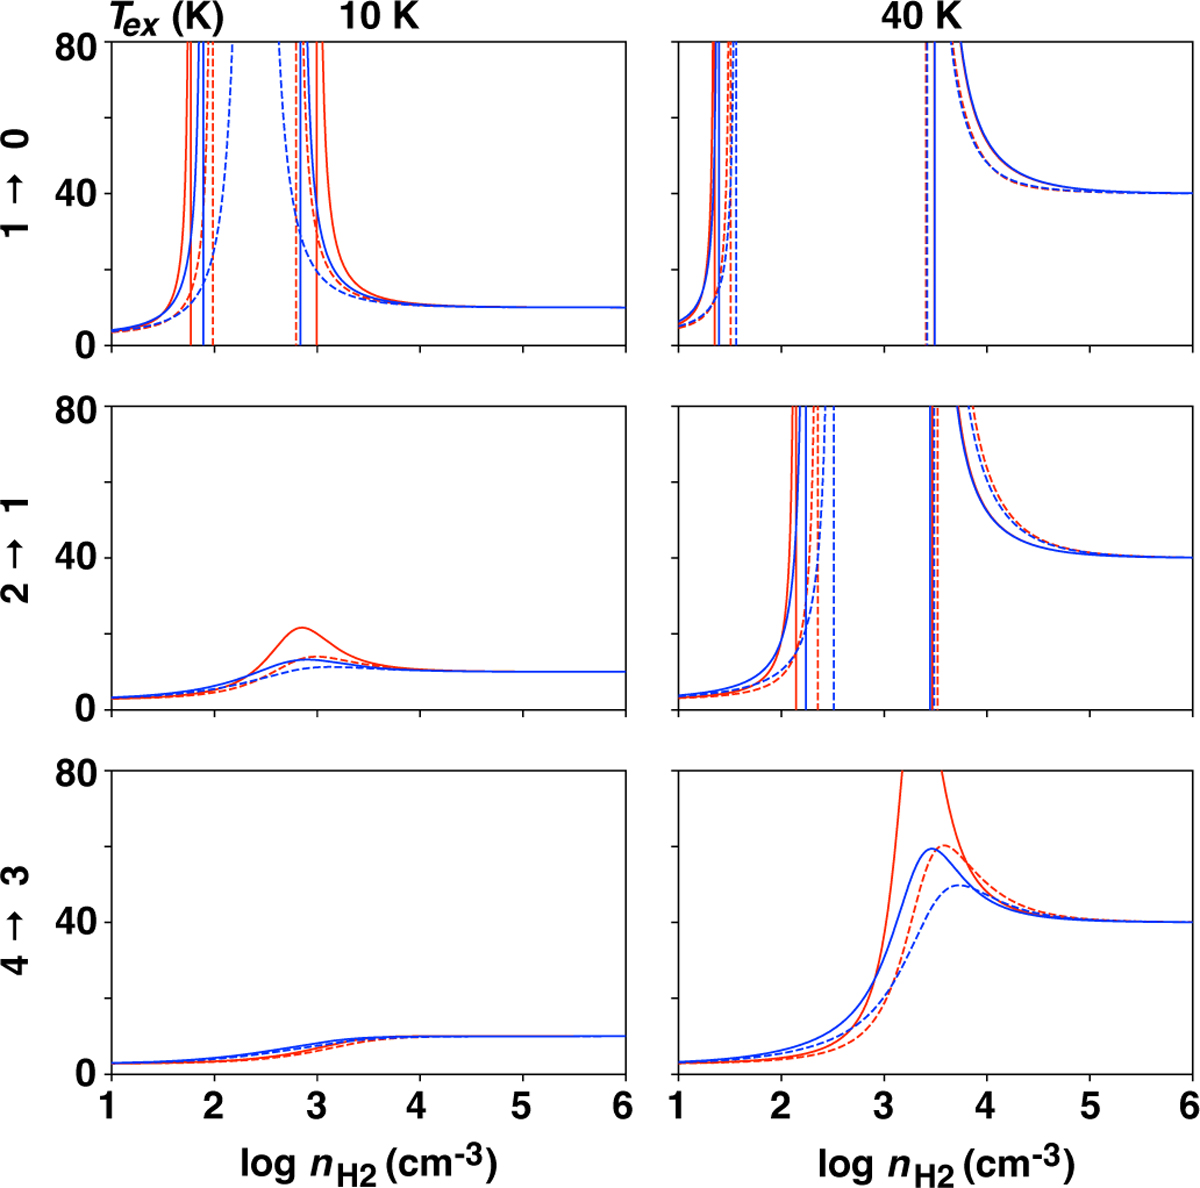
Fig. 6
Download original image
Excitation temperature, Tex, (in K) as a function of log(nH2) (in cm−3) at two kinetic temperatures – 10 K (left panels) and 40 K (right panels) – of the gas. Solid lines correspond to the Tex determined using the rate coefficients computed in this work, while dashed lines represent those from the LAMDA database. Red and blue lines indicate column densities of 1012 and 1015 cm−2, respectively.
Current usage metrics show cumulative count of Article Views (full-text article views including HTML views, PDF and ePub downloads, according to the available data) and Abstracts Views on Vision4Press platform.
Data correspond to usage on the plateform after 2015. The current usage metrics is available 48-96 hours after online publication and is updated daily on week days.
Initial download of the metrics may take a while.