Open Access
Fig. 2
Download original image
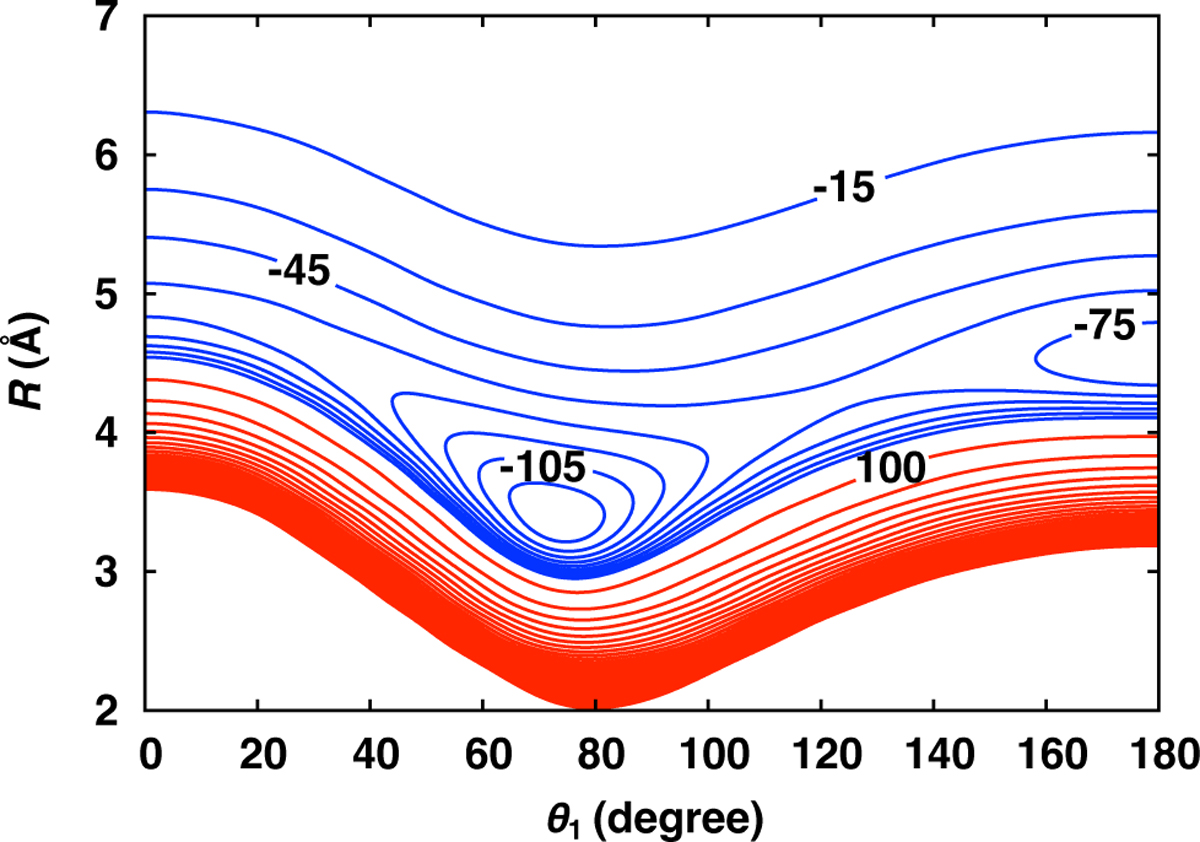
Contour plot of the averaged 2 D PES for the OCS+H2 complex. Positive energies (red contour lines) are equally spaced in steps of 200 cm−1, while energies ≤0 cm−1 (blue contour lines) are spaced in steps of 15 cm−1.
Current usage metrics show cumulative count of Article Views (full-text article views including HTML views, PDF and ePub downloads, according to the available data) and Abstracts Views on Vision4Press platform.
Data correspond to usage on the plateform after 2015. The current usage metrics is available 48-96 hours after online publication and is updated daily on week days.
Initial download of the metrics may take a while.