Fig. 7.
Download original image
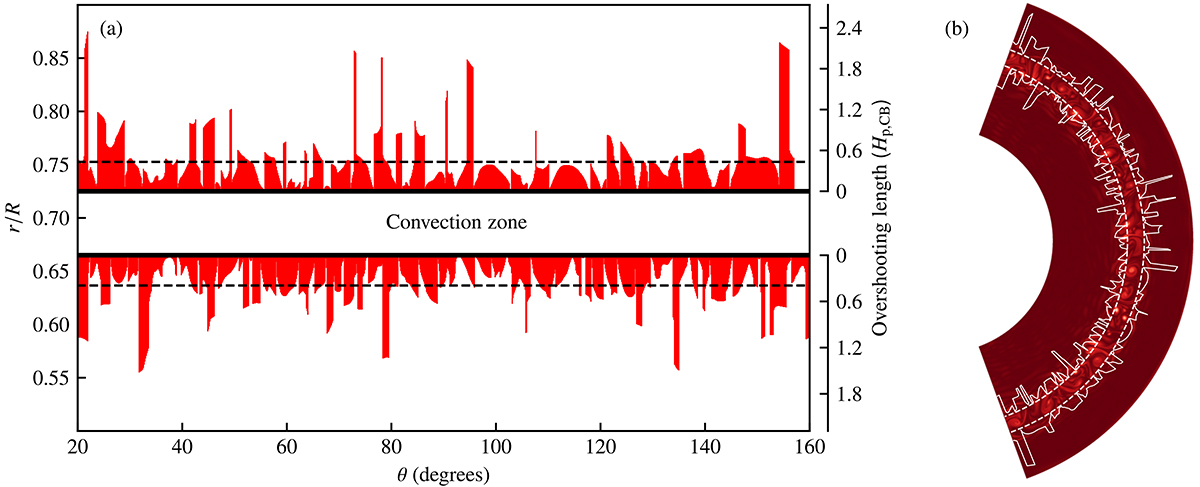
(a) Angular structure of the overshooting layer after 114τconv of steady-state convection in the simulation of the 6 M⊙ Cepheid. The overshooting length in this illustration is determined by zeros of the vertical kinetic flux. The Schwarzschild convective boundaries between the convection zone and the neighboring stable radiative zones are indicated by a solid black line. The stellar radius (r/R) is indicated on the left axis, and the overshooting length is given in units of the pressure scale height Hp, CB at the convective boundaries on the right axis. A dashed line indicates the average overshooting length at this time. (b) The same, but plotted over a visualization of vorticity. White dashed lines indicate the Schwarzschild boundaries.
Current usage metrics show cumulative count of Article Views (full-text article views including HTML views, PDF and ePub downloads, according to the available data) and Abstracts Views on Vision4Press platform.
Data correspond to usage on the plateform after 2015. The current usage metrics is available 48-96 hours after online publication and is updated daily on week days.
Initial download of the metrics may take a while.