Fig. 5.
Download original image
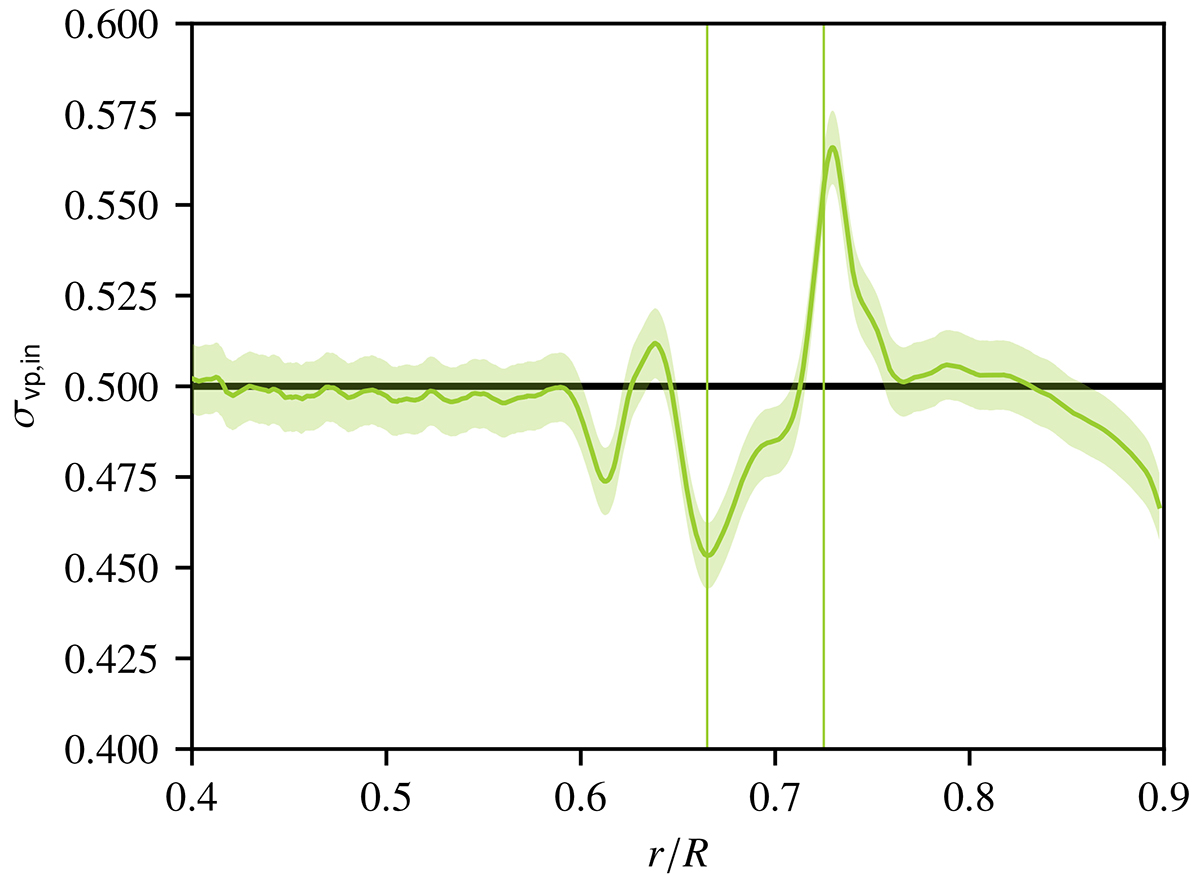
Radial profile of the time-averaged volume percentage filling factor of the inward moving plumes σvp, in versus the star’s internal radius, in units of the total stellar radius R for the 6 M⊙ simulation. The shaded area indicates one standard deviation above and below this averaged line and thin vertical lines indicate the Schwarzschild boundaries.
Current usage metrics show cumulative count of Article Views (full-text article views including HTML views, PDF and ePub downloads, according to the available data) and Abstracts Views on Vision4Press platform.
Data correspond to usage on the plateform after 2015. The current usage metrics is available 48-96 hours after online publication and is updated daily on week days.
Initial download of the metrics may take a while.