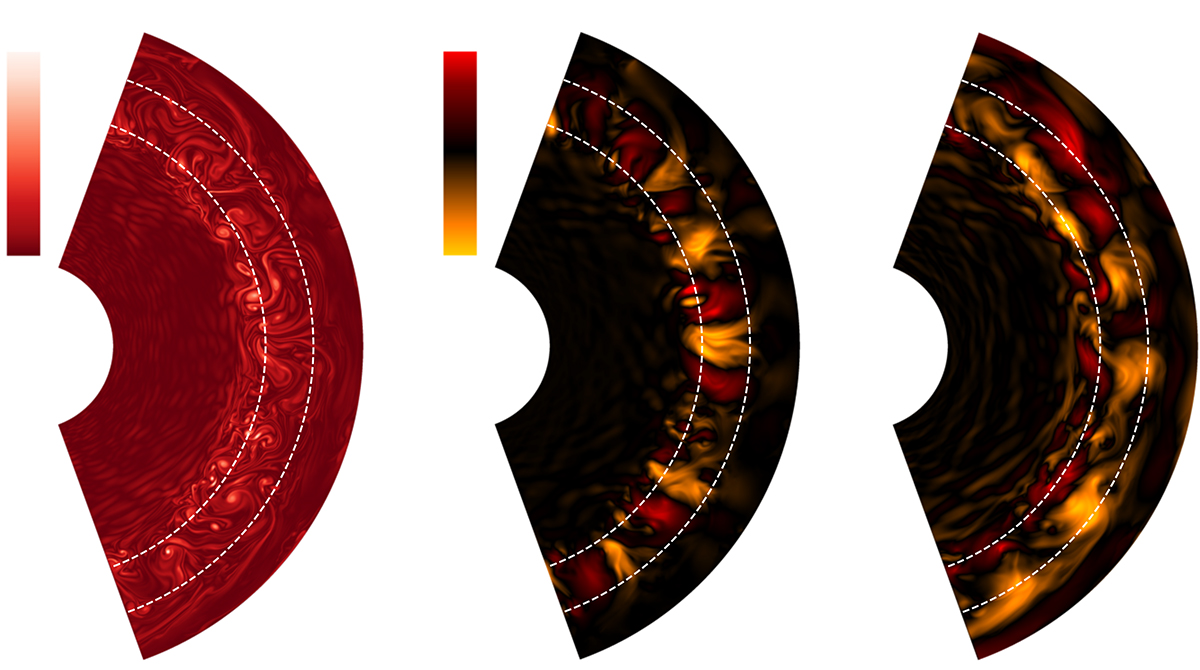
Fig. 3.
Download original image
Visualizations of (from left to right) vorticity magnitude, radial velocity, and angular velocity of the 8 M⊙ simulation after 30τconv of steady-state convection. The zero point for vorticity is in dark red in the left panel. In the center and right panels, outwards flows are in red while inwards flows are in yellow; the zero point in velocity is black. The radial velocity ranges from −9.25 × 105 cm/s to 9.25 × 105 cm/s at this instant in time, while the angular velocity ranges from −1.01 × 106 cm/s to 1.01 × 106 cm/s. Dashed white lines indicate the position of the Schwarzschild boundaries.
Current usage metrics show cumulative count of Article Views (full-text article views including HTML views, PDF and ePub downloads, according to the available data) and Abstracts Views on Vision4Press platform.
Data correspond to usage on the plateform after 2015. The current usage metrics is available 48-96 hours after online publication and is updated daily on week days.
Initial download of the metrics may take a while.