Fig. 2.
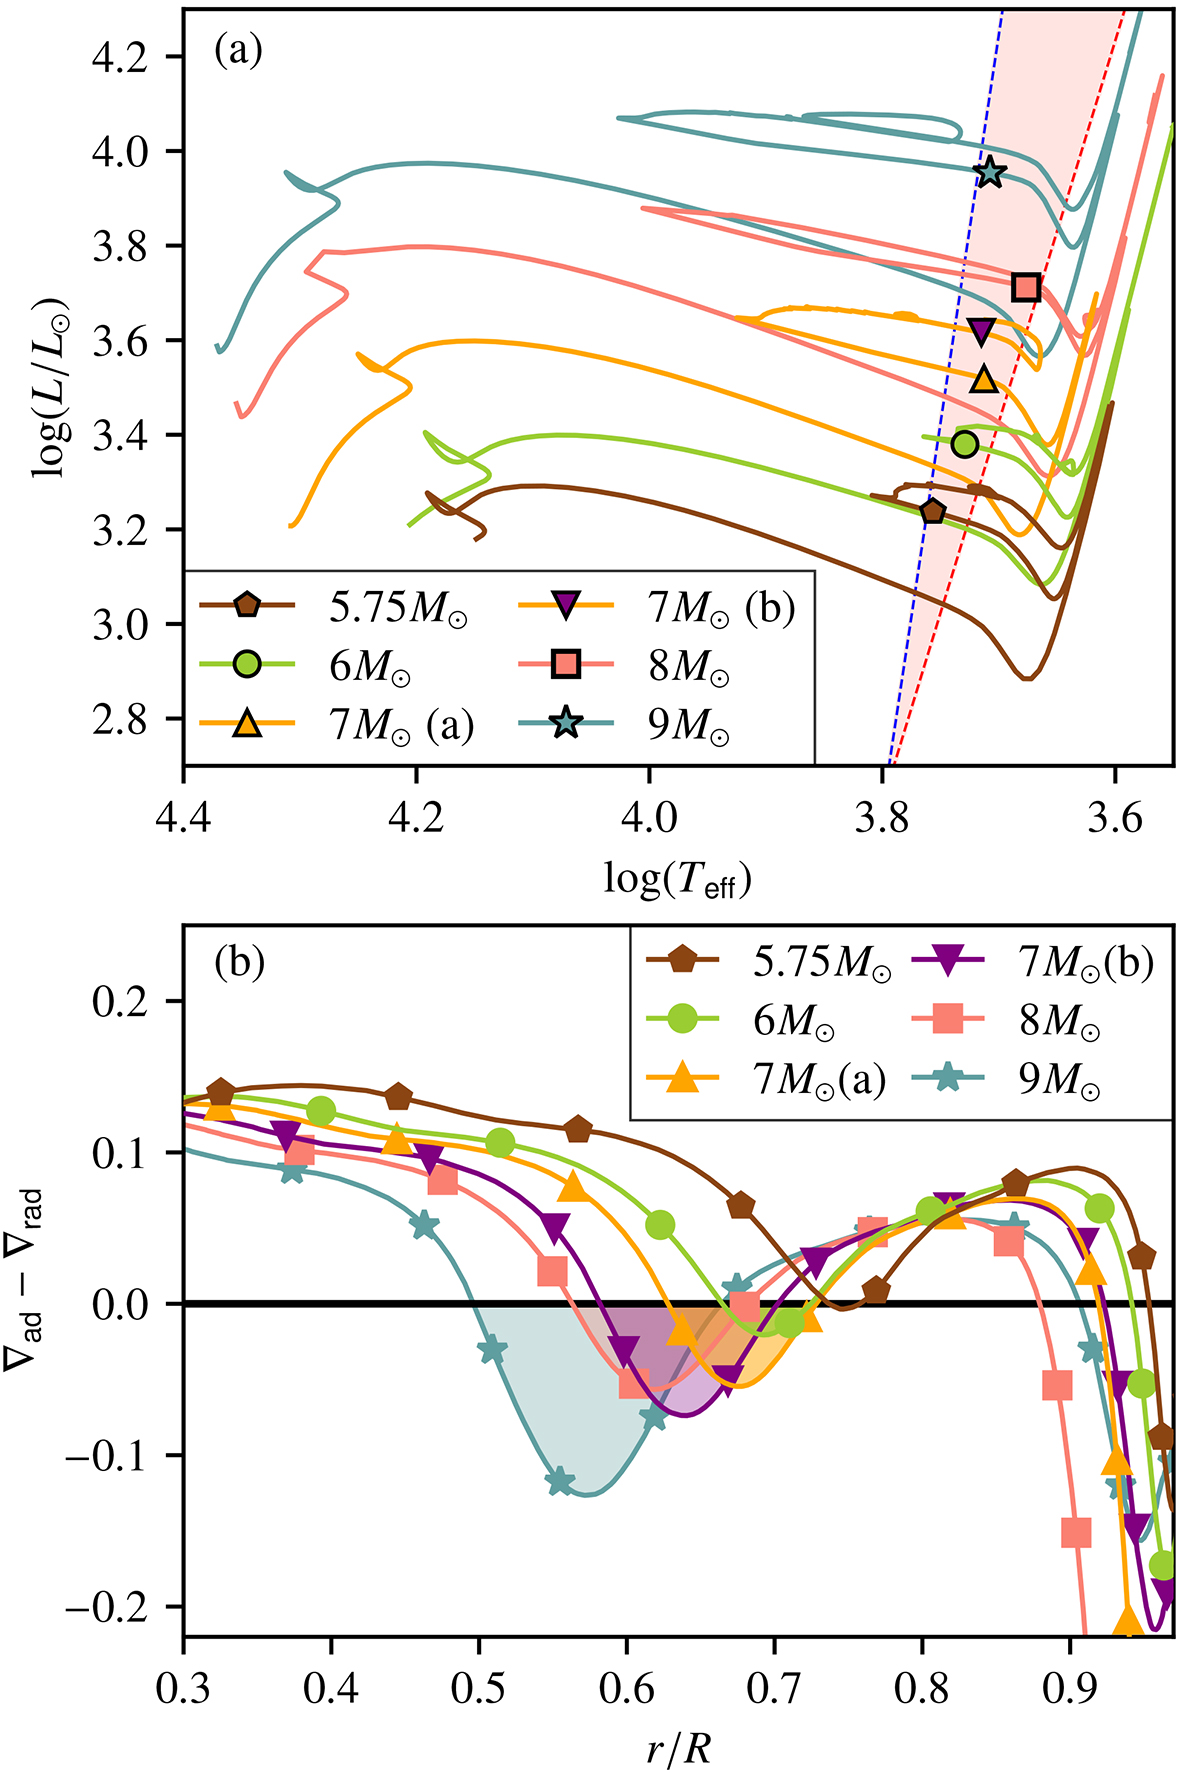
Download original image
(a) Hertzprung-Russel diagram and (b) radial profile of the Schwarzschild discriminant, for the six stars we simulated with MUSIC. Symbols indicate the Cepheids we simulated, and the pink shaded area indicates the instability strip for the evolutionary tracks. Shaded regions also highlight the internal convection zones around which our hydrodynamic simulations are centered.
Current usage metrics show cumulative count of Article Views (full-text article views including HTML views, PDF and ePub downloads, according to the available data) and Abstracts Views on Vision4Press platform.
Data correspond to usage on the plateform after 2015. The current usage metrics is available 48-96 hours after online publication and is updated daily on week days.
Initial download of the metrics may take a while.