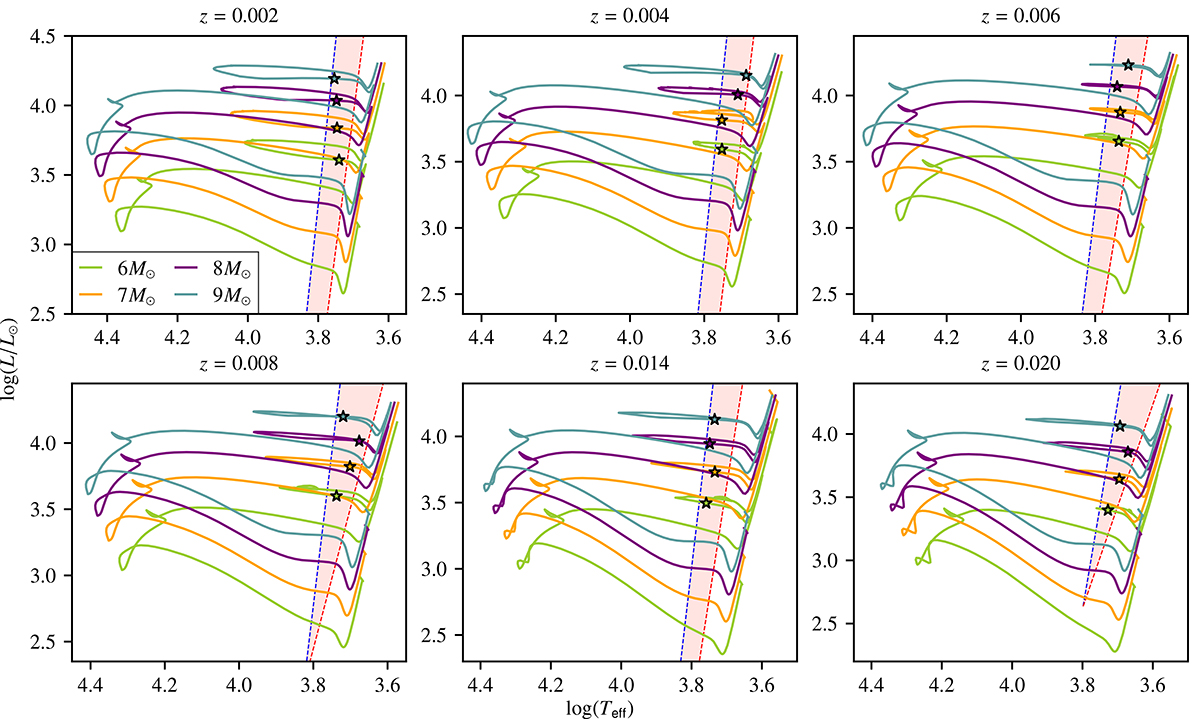
Fig. A.1.
Download original image
Hertzprung–Russell diagrams of 6, 7, 8, and 9 M⊙ stars of six different metallicities. The symbols indicate structures of individual Cepheid variable stars that lie in the instability strip (pink shaded area) and that we examine further in Appendix A. The blue and red edges of the instability strips were estimated from the work of Anderson et al. (2016) for z = 0.002, z = 0.006 and z = 0.014, from the work of Alibert et al. (1999) for z = 0.004, and from the theoretical relationships of Bono et al. (2000) for z = 0.008 and z = 0.020. L is the luminosity of the star, expressed in units of the luminosity of the sun L⊙ (we use L⊙ = 3.828 × 1033erg.s−1), and Teff denotes its effective temperature. Evolutionary tracks with different masses are distinguished by color.
Current usage metrics show cumulative count of Article Views (full-text article views including HTML views, PDF and ePub downloads, according to the available data) and Abstracts Views on Vision4Press platform.
Data correspond to usage on the plateform after 2015. The current usage metrics is available 48-96 hours after online publication and is updated daily on week days.
Initial download of the metrics may take a while.