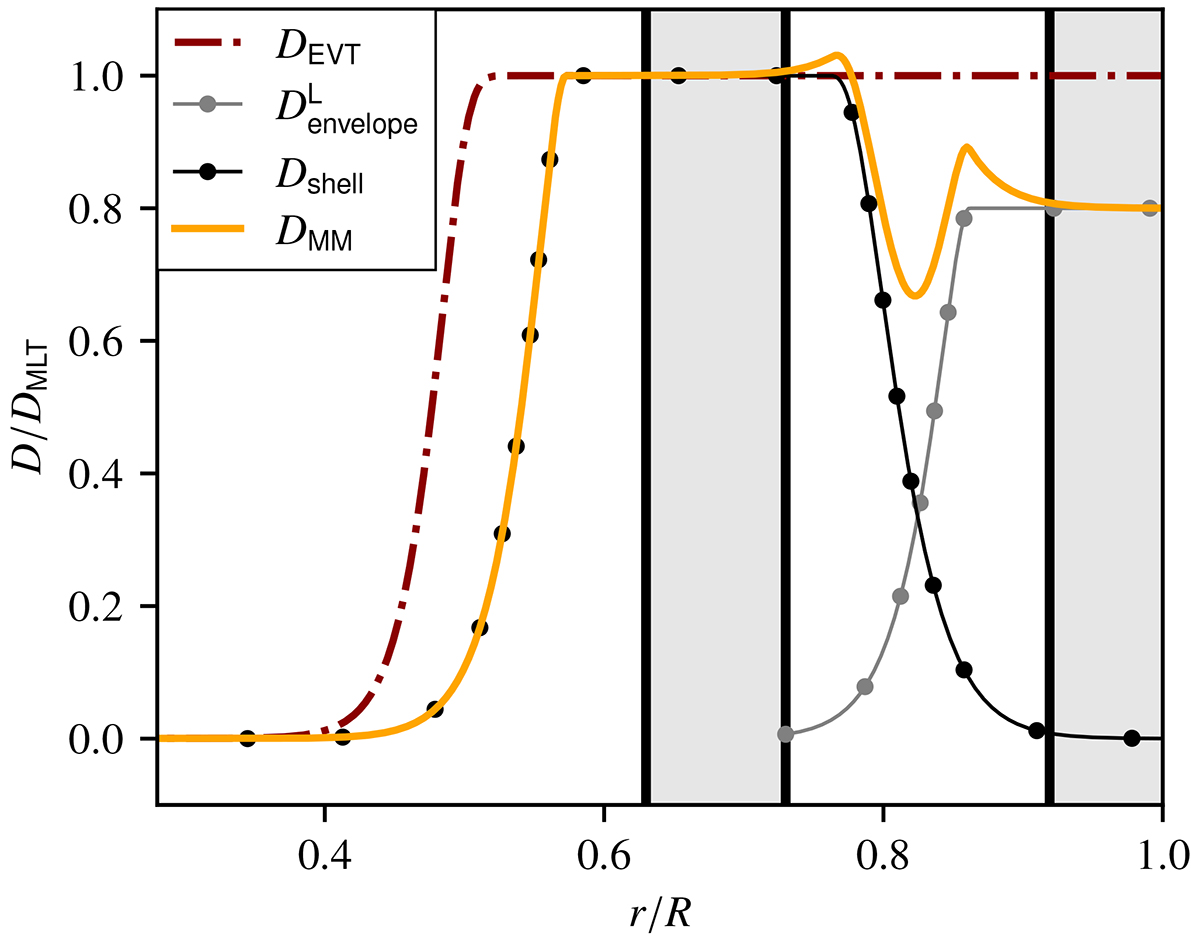
Fig. 13.
Download original image
Diffusion coefficient for the 7 M⊙ (a) Cepheid. Heavy black lines indicate the convective boundaries of both the convective shell and the outer convection zone. The thin black dotted line is the diffusion coefficient of the convective shell based on the mixture model proposed in Eq. (18), and the red dashed line is the diffusion coefficient based on the EVT analysis (Eq. (17)). A gray line extrapolates our model to show a possible diffusion coefficient for the outer convection zone. The solid yellow line is a model for mixing in the radiative zone that experiences overshooting from both above and below, based on Eq. (20). In this example, DMLTenvelope = 0.8 DMLT.
Current usage metrics show cumulative count of Article Views (full-text article views including HTML views, PDF and ePub downloads, according to the available data) and Abstracts Views on Vision4Press platform.
Data correspond to usage on the plateform after 2015. The current usage metrics is available 48-96 hours after online publication and is updated daily on week days.
Initial download of the metrics may take a while.