Fig. 6
Download original image
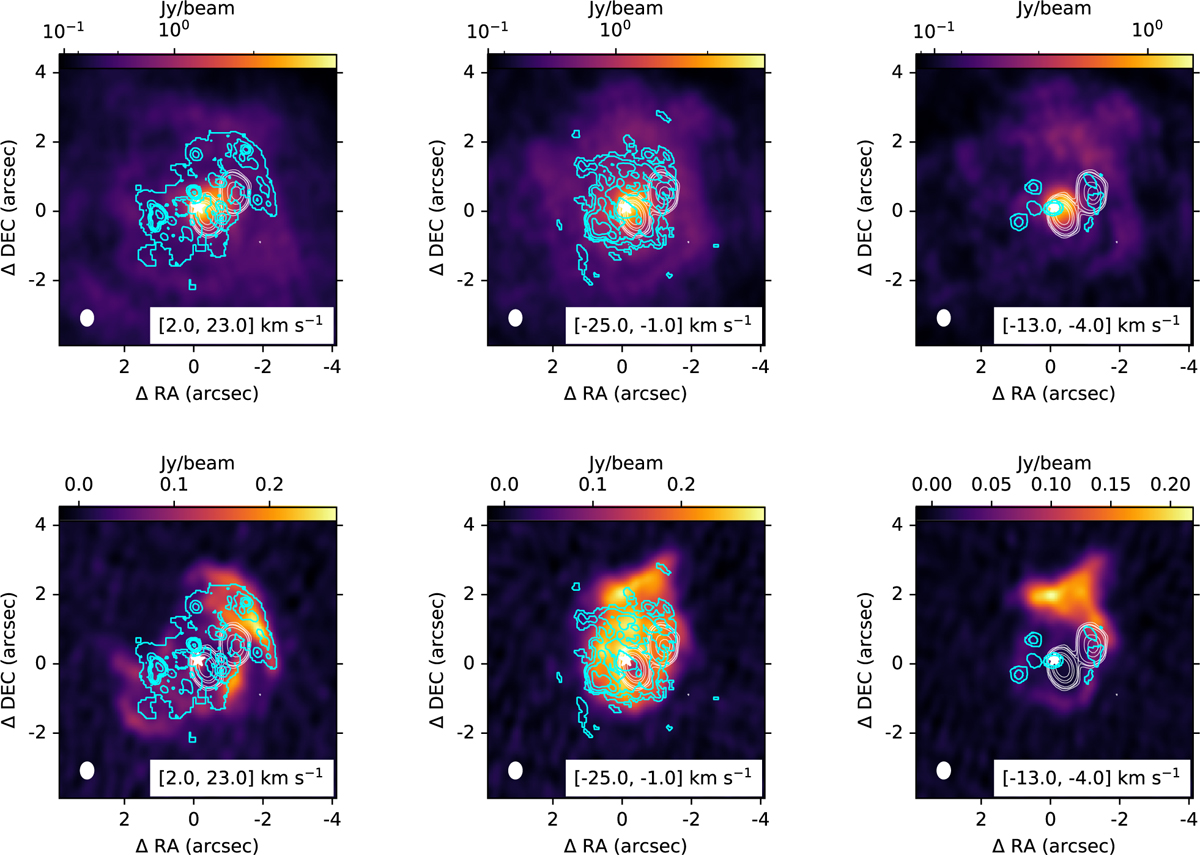
Comparison of OH maser emission and our NOEMA observations. The colour maps show moment-0 maps of CO J = 2 - 1 (top) and SO2 JKa,Kc = 111,11 - 100,10 (bottom) line emission (colour maps) constructed for the velocity ranges specified in each panel's lower right corner, in accordance with the ranges covered by the maser emission. Contours show the NOEMA continuum emission (white) and the OH maser emission from Etoka & Diamond (2004) in cyan. These are, from left to right: red-shifted OH 1612 MHz, blue-shifted OH 1612 MHz, and blue-shifted OH 1665 MHz. The beams of the line emission measured with NOEMA are given in the bottom-left corner of each panel as white ellipses.
Current usage metrics show cumulative count of Article Views (full-text article views including HTML views, PDF and ePub downloads, according to the available data) and Abstracts Views on Vision4Press platform.
Data correspond to usage on the plateform after 2015. The current usage metrics is available 48-96 hours after online publication and is updated daily on week days.
Initial download of the metrics may take a while.