Fig. 3
Download original image
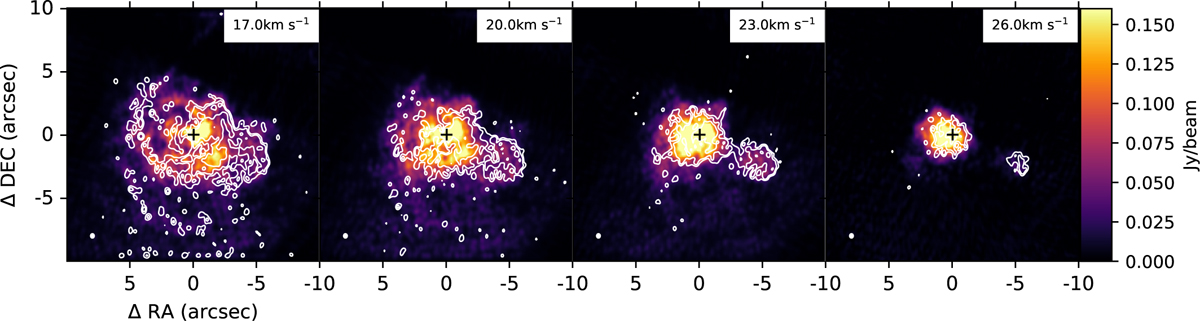
Blob of CO emission to the SW of the star. The panels show of the 12CO J = 2 - 1 emission (colour) and 13CO J = 2 - 1 emission (white contours at [3, 5, 10]σ) across the velocity range [17; 26] kms−1. The extent of the colour scale has been limited for the sake of visibility. The stellar position is indicated as a black cross (+), the NOEMA beam is plotted in the bottom left corner as a white filled ellipse.
Current usage metrics show cumulative count of Article Views (full-text article views including HTML views, PDF and ePub downloads, according to the available data) and Abstracts Views on Vision4Press platform.
Data correspond to usage on the plateform after 2015. The current usage metrics is available 48-96 hours after online publication and is updated daily on week days.
Initial download of the metrics may take a while.