Fig. 2
Download original image
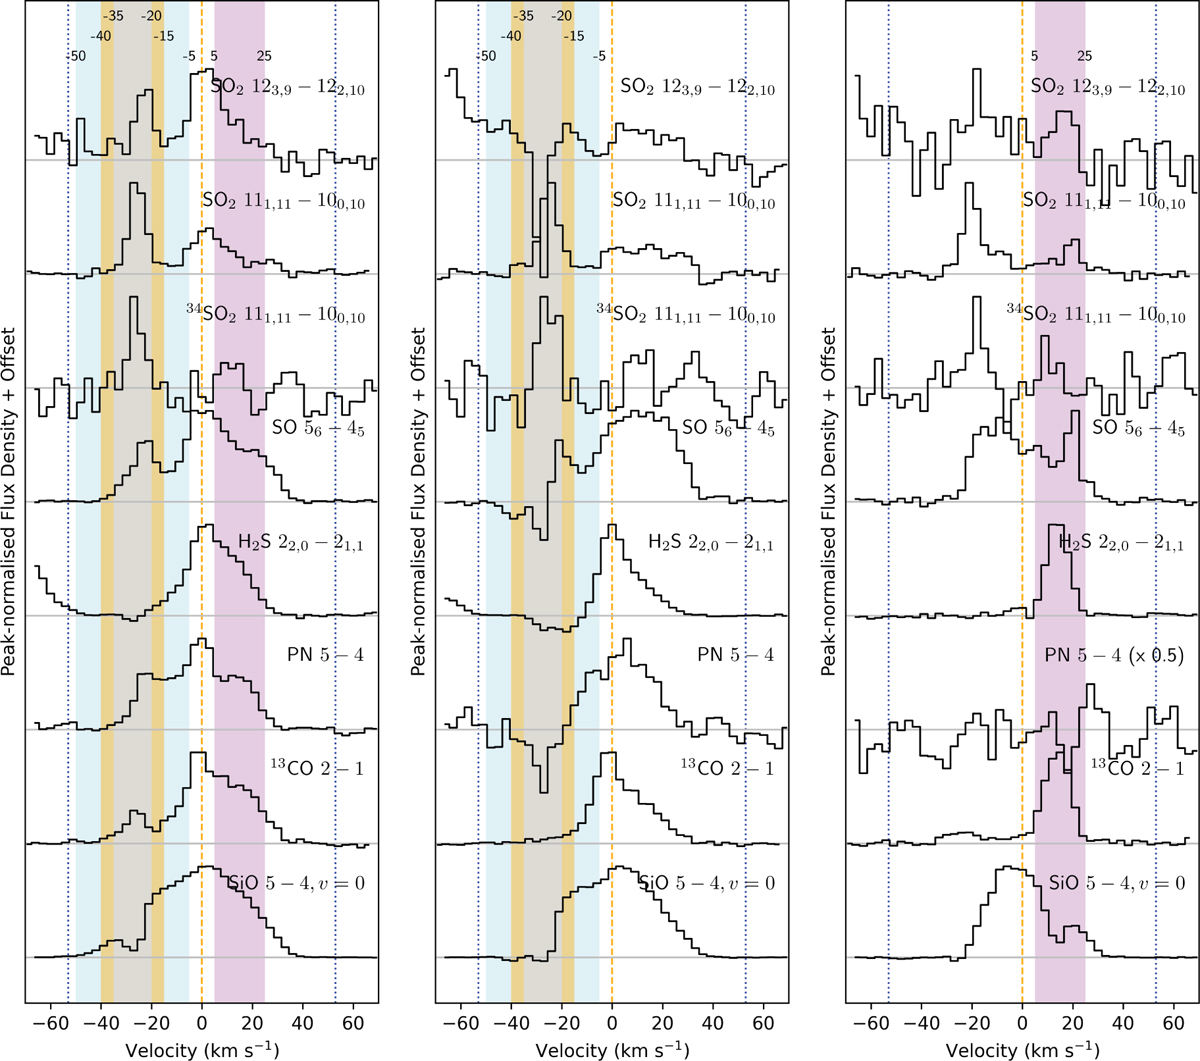
Pencil-beam spectra towards NML Cyg, extracted towards the stellar position (left) and towards the peak positions of components A (middle) and B (right). The spectra have been normalised to their peak and a vertical offset has been added. The transitions are labelled in each panel. Note: the spectrum of PN 5 - 4 towards component B has been scaled for the sake of visualisation. Shaded regions indicate velocity ranges of interest with respect to absorption and emission features, with the relevant boundaries indicated in the top of each panel.
Current usage metrics show cumulative count of Article Views (full-text article views including HTML views, PDF and ePub downloads, according to the available data) and Abstracts Views on Vision4Press platform.
Data correspond to usage on the plateform after 2015. The current usage metrics is available 48-96 hours after online publication and is updated daily on week days.
Initial download of the metrics may take a while.