Fig. 1
Download original image
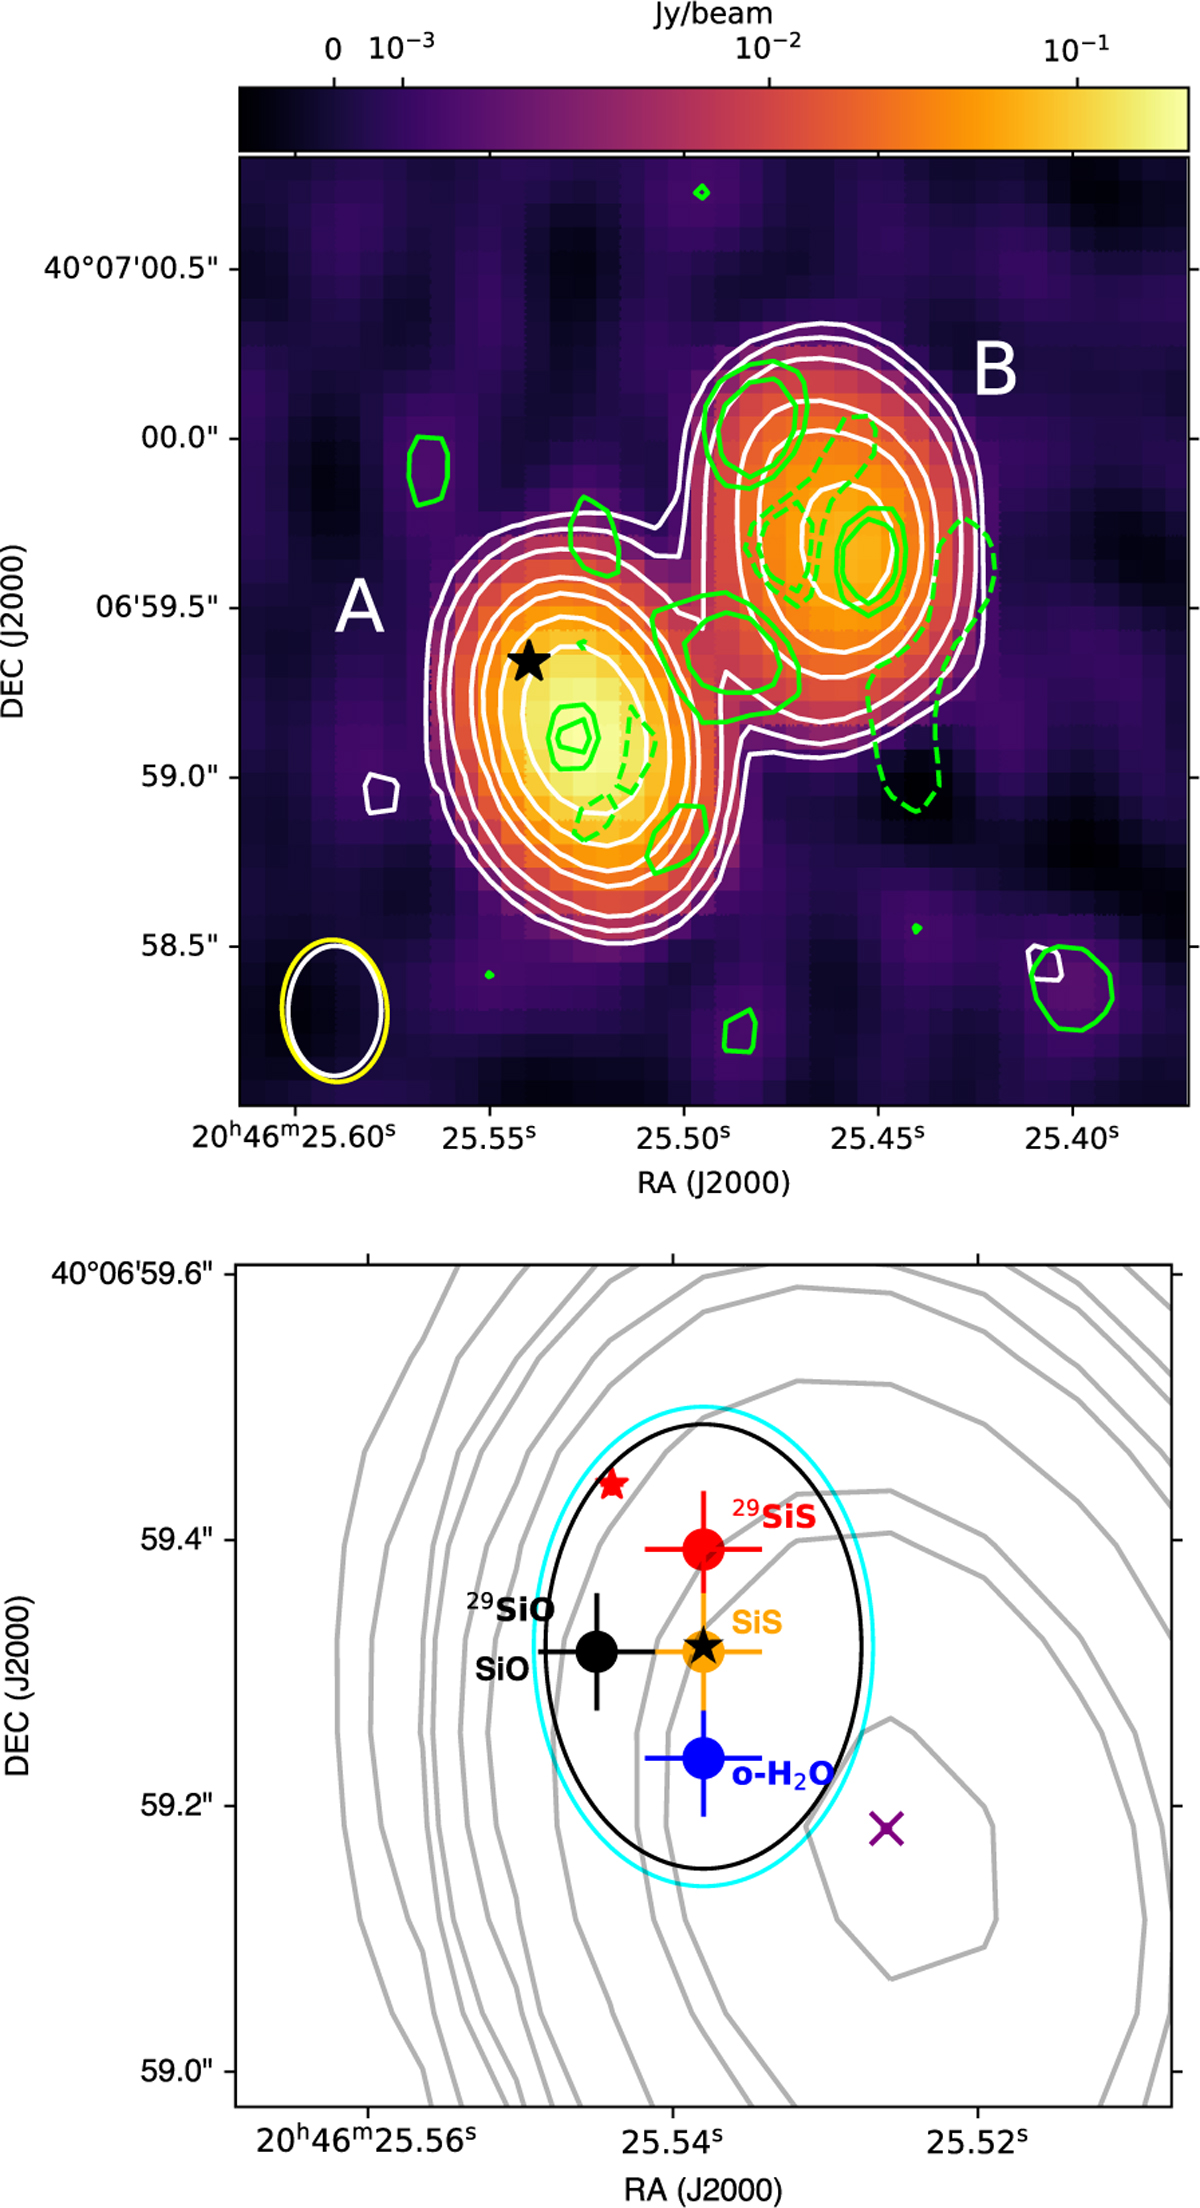
Continuum emission from NML Cyg. (Top) Emission in LSB (colour map) and USB (white contours at 3, 5, 10, 30, 50, 100, 200 σ), with two continuum components labelled as A and B and the stellar position as a black star. The synthesised beam is shown in the bottom left corner (LSB: yellow, USB: white). Residuals in USB after subtraction of the IMFIT results are shown in green contours (at -10, -5, -3, 3, 5, 10 σ) with dashed contours for negative signal. (Bottom) Estimating the stellar position. Peak flux positions of selected molecular transitions with errors according to the 50 mas astrometric accuracy (filled circles) at systemic velocity overlaid on USB continuum contours (grey) from the top panel. Also indicated: continuum peak (purple X), stellar position extrapolated from Zhang et al. (2012b) (black star), peak position of HST 0.55 μm emission (red star), and LSB and USB beams (cyan and black ellipses).
Current usage metrics show cumulative count of Article Views (full-text article views including HTML views, PDF and ePub downloads, according to the available data) and Abstracts Views on Vision4Press platform.
Data correspond to usage on the plateform after 2015. The current usage metrics is available 48-96 hours after online publication and is updated daily on week days.
Initial download of the metrics may take a while.