Fig. 9
Download original image
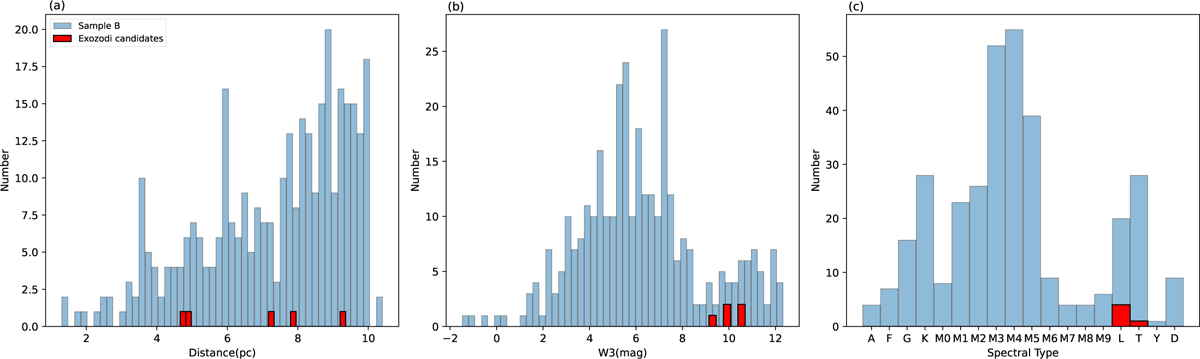
(a) Distribution of distances for the five exozodi candidates (in red) compared to those in Sample B (in sky blue). (b) Distribution of WISE W3 magnitudes for the five exozodi candidates (in red) relative to Sample B (in sky blue). (c) Distribution of spectral types for the five exozodi candidates (in red) in relation to Sample B (in sky blue).
Current usage metrics show cumulative count of Article Views (full-text article views including HTML views, PDF and ePub downloads, according to the available data) and Abstracts Views on Vision4Press platform.
Data correspond to usage on the plateform after 2015. The current usage metrics is available 48-96 hours after online publication and is updated daily on week days.
Initial download of the metrics may take a while.