Fig. 2
Download original image
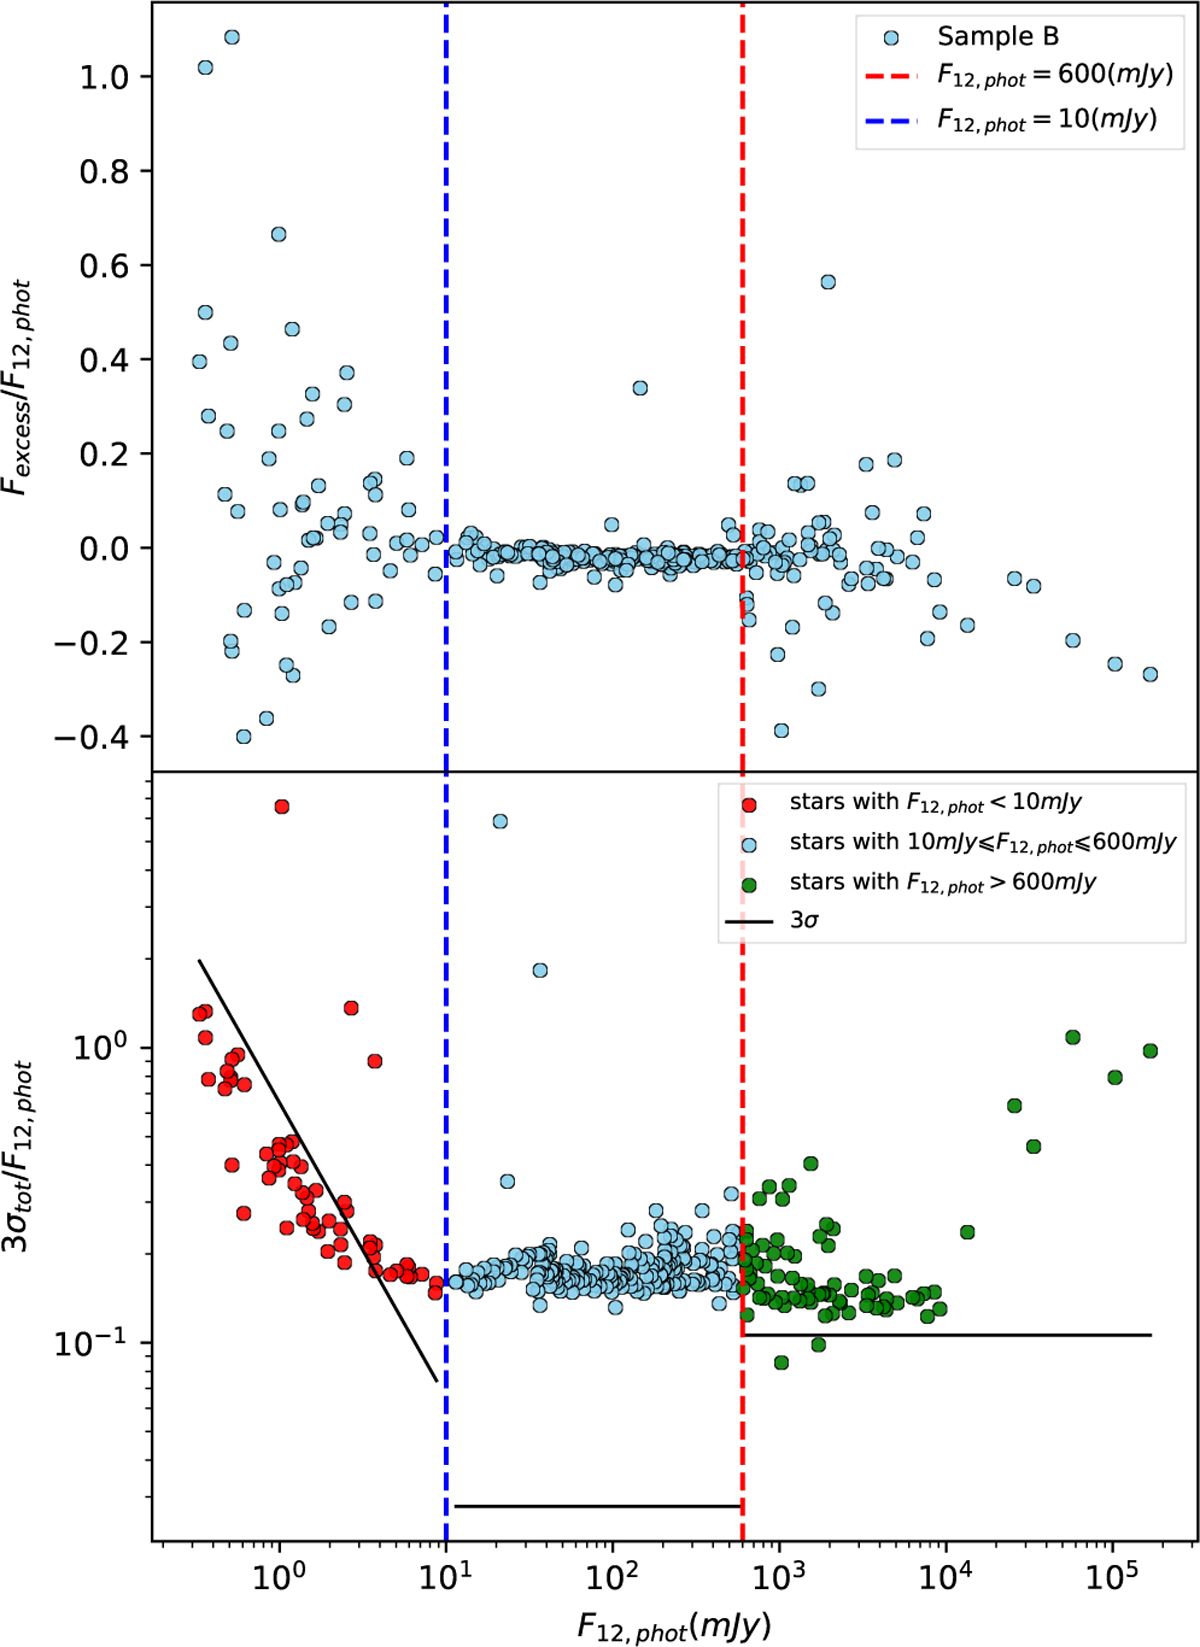
Scatter plot of Fexcess/F12,phot versus F12,phot for Sample B stars. The vertical dashed lines represent the boundaries at F12,phot = 10 mJy (blue) and F12,phot = 600 mJy (red), indicating different flux regimes. The bottom panel is divided into three regions based on F12,phot : red dots represent stars with F12,phot < 10mJy; blue dots represent stars with 10mJy ⩽0 F12,phot ⩽ 600 mJy; green dots represent stars with F12,phot > 600 mJy. And the black line represents the empirical measure of uncertainty 3σ for each regime.
Current usage metrics show cumulative count of Article Views (full-text article views including HTML views, PDF and ePub downloads, according to the available data) and Abstracts Views on Vision4Press platform.
Data correspond to usage on the plateform after 2015. The current usage metrics is available 48-96 hours after online publication and is updated daily on week days.
Initial download of the metrics may take a while.