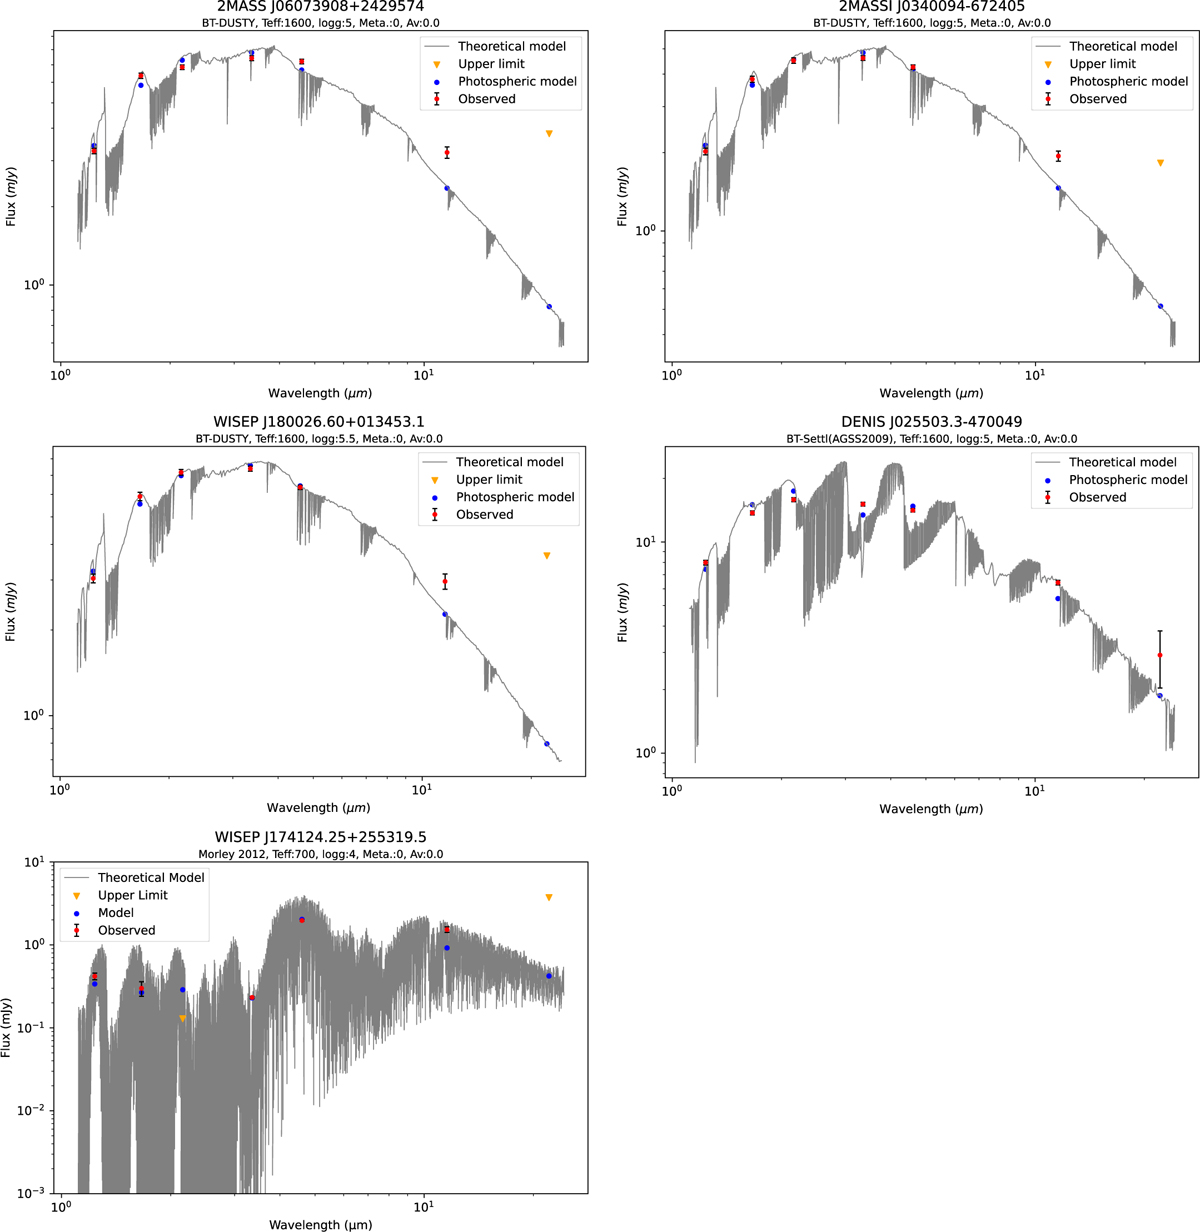
Fig. A.2
Download original image
SEDs for the five exozodi candidates. The red dots represent the observed photometry in the NIR and IR bands (J,H,Ks, W1,W2,W3 and W4). The inverted yellow triangles indicate upper limits, which are not used for the fitting. The blue dots represent the best-fit photospheric model flux, with the theoretical spectrum plotted behind it in gray.
Current usage metrics show cumulative count of Article Views (full-text article views including HTML views, PDF and ePub downloads, according to the available data) and Abstracts Views on Vision4Press platform.
Data correspond to usage on the plateform after 2015. The current usage metrics is available 48-96 hours after online publication and is updated daily on week days.
Initial download of the metrics may take a while.