Fig. A.1
Download original image
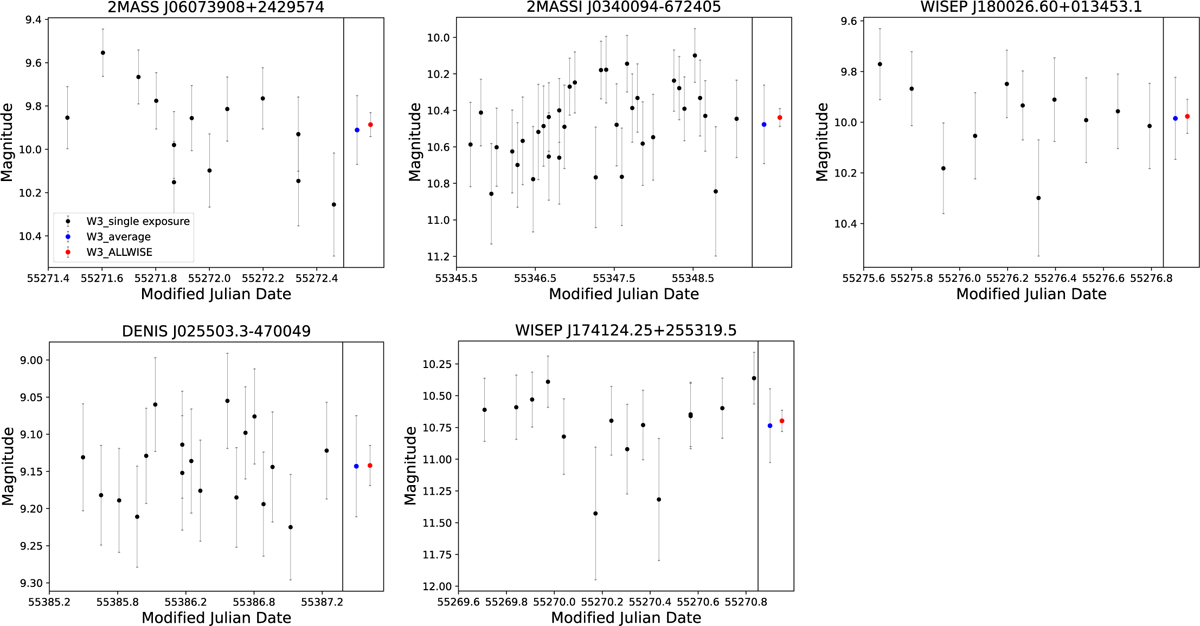
Light curves of the five targets observed with the WISE W3 band. Each panel shows the magnitude variation over Modified Julian Date. Error bars represent measurement uncertainties. We also plot the W3 flux value (and its associated error) used in Sect. 3 (Identifying IR excess) directly in the right region of each panel as the red dot shows, as well as the blue dot which represents the average of all single exposure measurements data for comparison.
Current usage metrics show cumulative count of Article Views (full-text article views including HTML views, PDF and ePub downloads, according to the available data) and Abstracts Views on Vision4Press platform.
Data correspond to usage on the plateform after 2015. The current usage metrics is available 48-96 hours after online publication and is updated daily on week days.
Initial download of the metrics may take a while.