Open Access
Fig. 1
Download original image
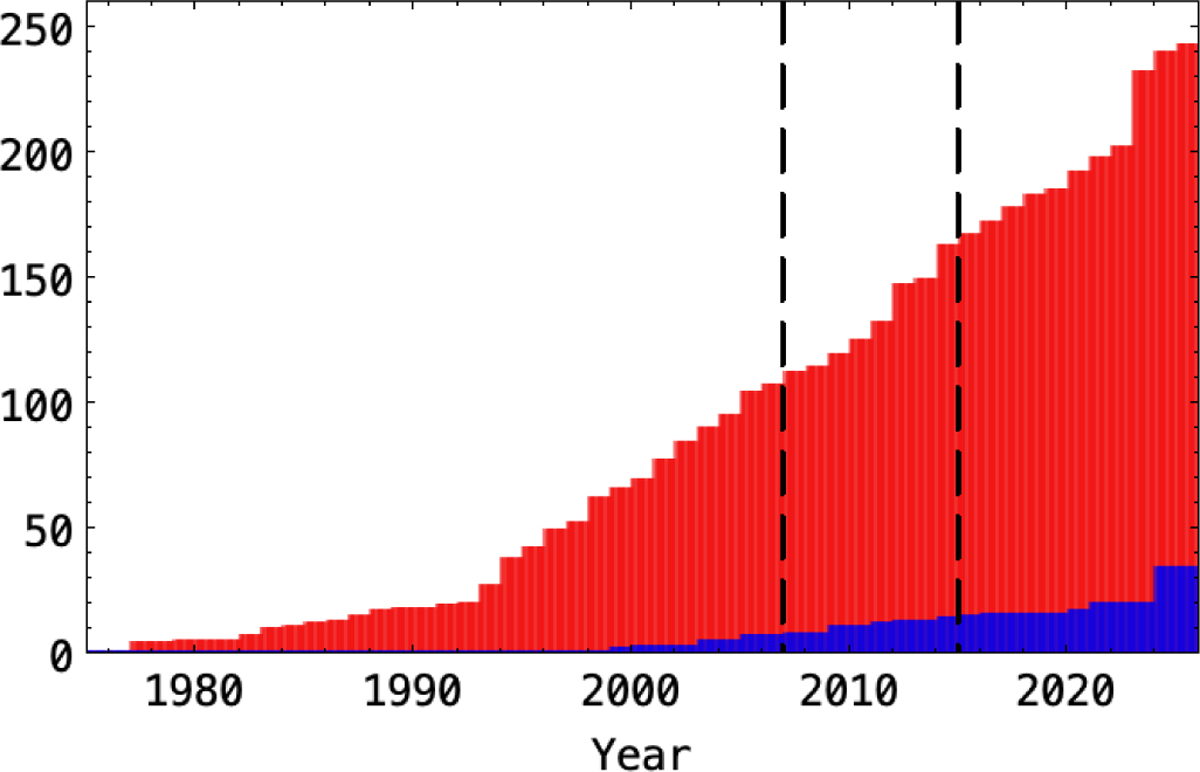
Growing population of polars and LARPs. The vertical dashed lines illustrate approximate dates of the final catalog compiled by Ritter & Kolb (2003) and the compilation of magnetic WDs by Ferrario et al. (2015). Here and in the following figures, red indicates polars, while blue indicates LARPs.
Current usage metrics show cumulative count of Article Views (full-text article views including HTML views, PDF and ePub downloads, according to the available data) and Abstracts Views on Vision4Press platform.
Data correspond to usage on the plateform after 2015. The current usage metrics is available 48-96 hours after online publication and is updated daily on week days.
Initial download of the metrics may take a while.