Fig. 7.
Download original image
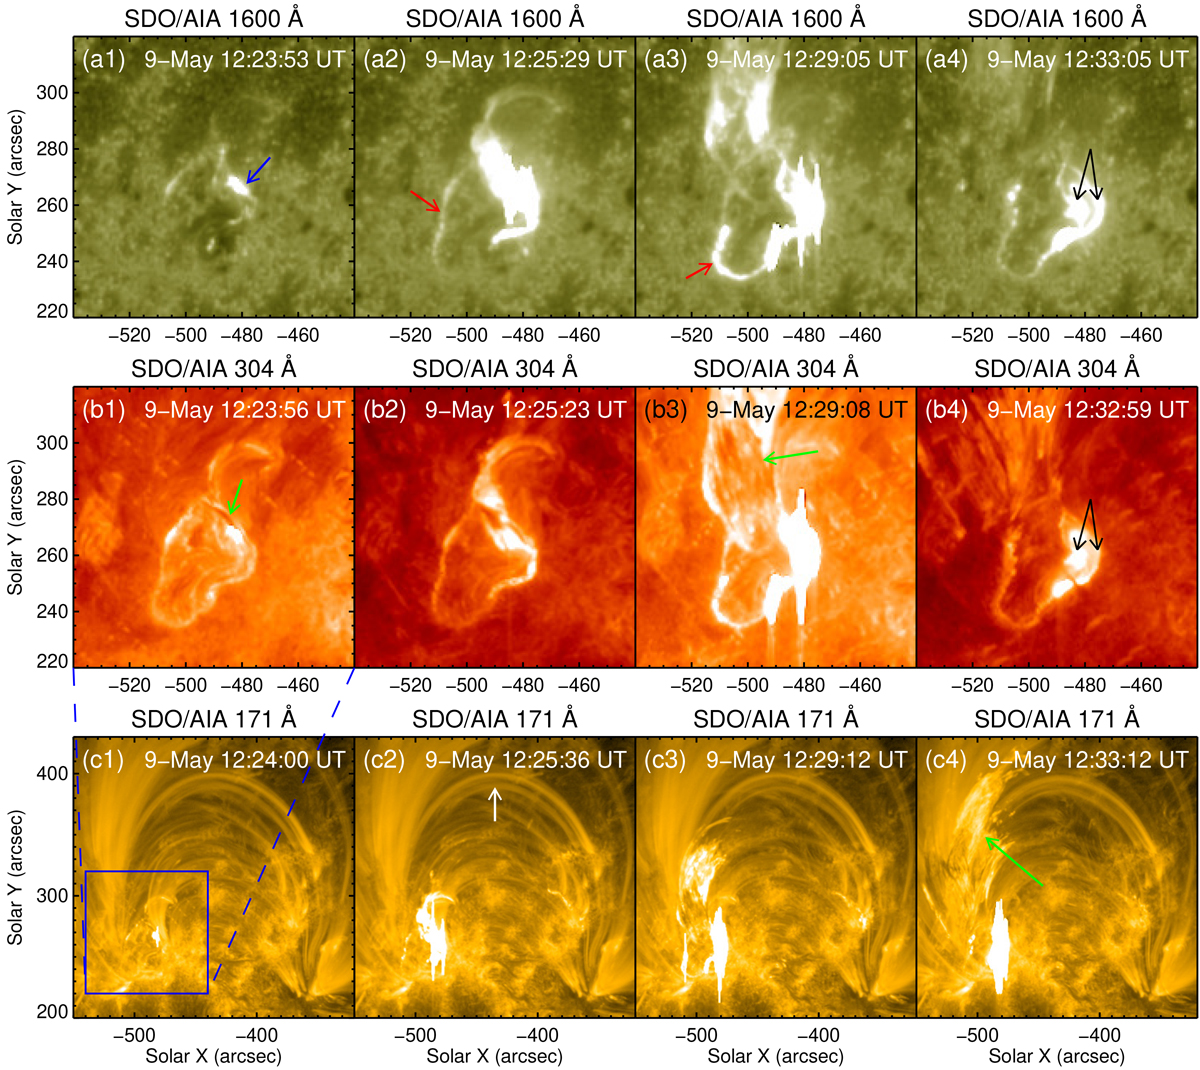
Multiwavelength images displaying the evolution of Flare 2. (a1)–(a4) AIA 1600 Å images. (b1)–(b4) AIA 304 Å images. (c1)–(c4) AIA 171 Å images. The blue, red, black, green, and white arrows denote the brightening, circular ribbon, a pair of parallel ribbons, filament material, and large-scale loops, respectively. The blue window in (c1) outlines the FOV of the top and middle panels. An animation (Movie2.mp4) of this figure is available online.
Current usage metrics show cumulative count of Article Views (full-text article views including HTML views, PDF and ePub downloads, according to the available data) and Abstracts Views on Vision4Press platform.
Data correspond to usage on the plateform after 2015. The current usage metrics is available 48-96 hours after online publication and is updated daily on week days.
Initial download of the metrics may take a while.