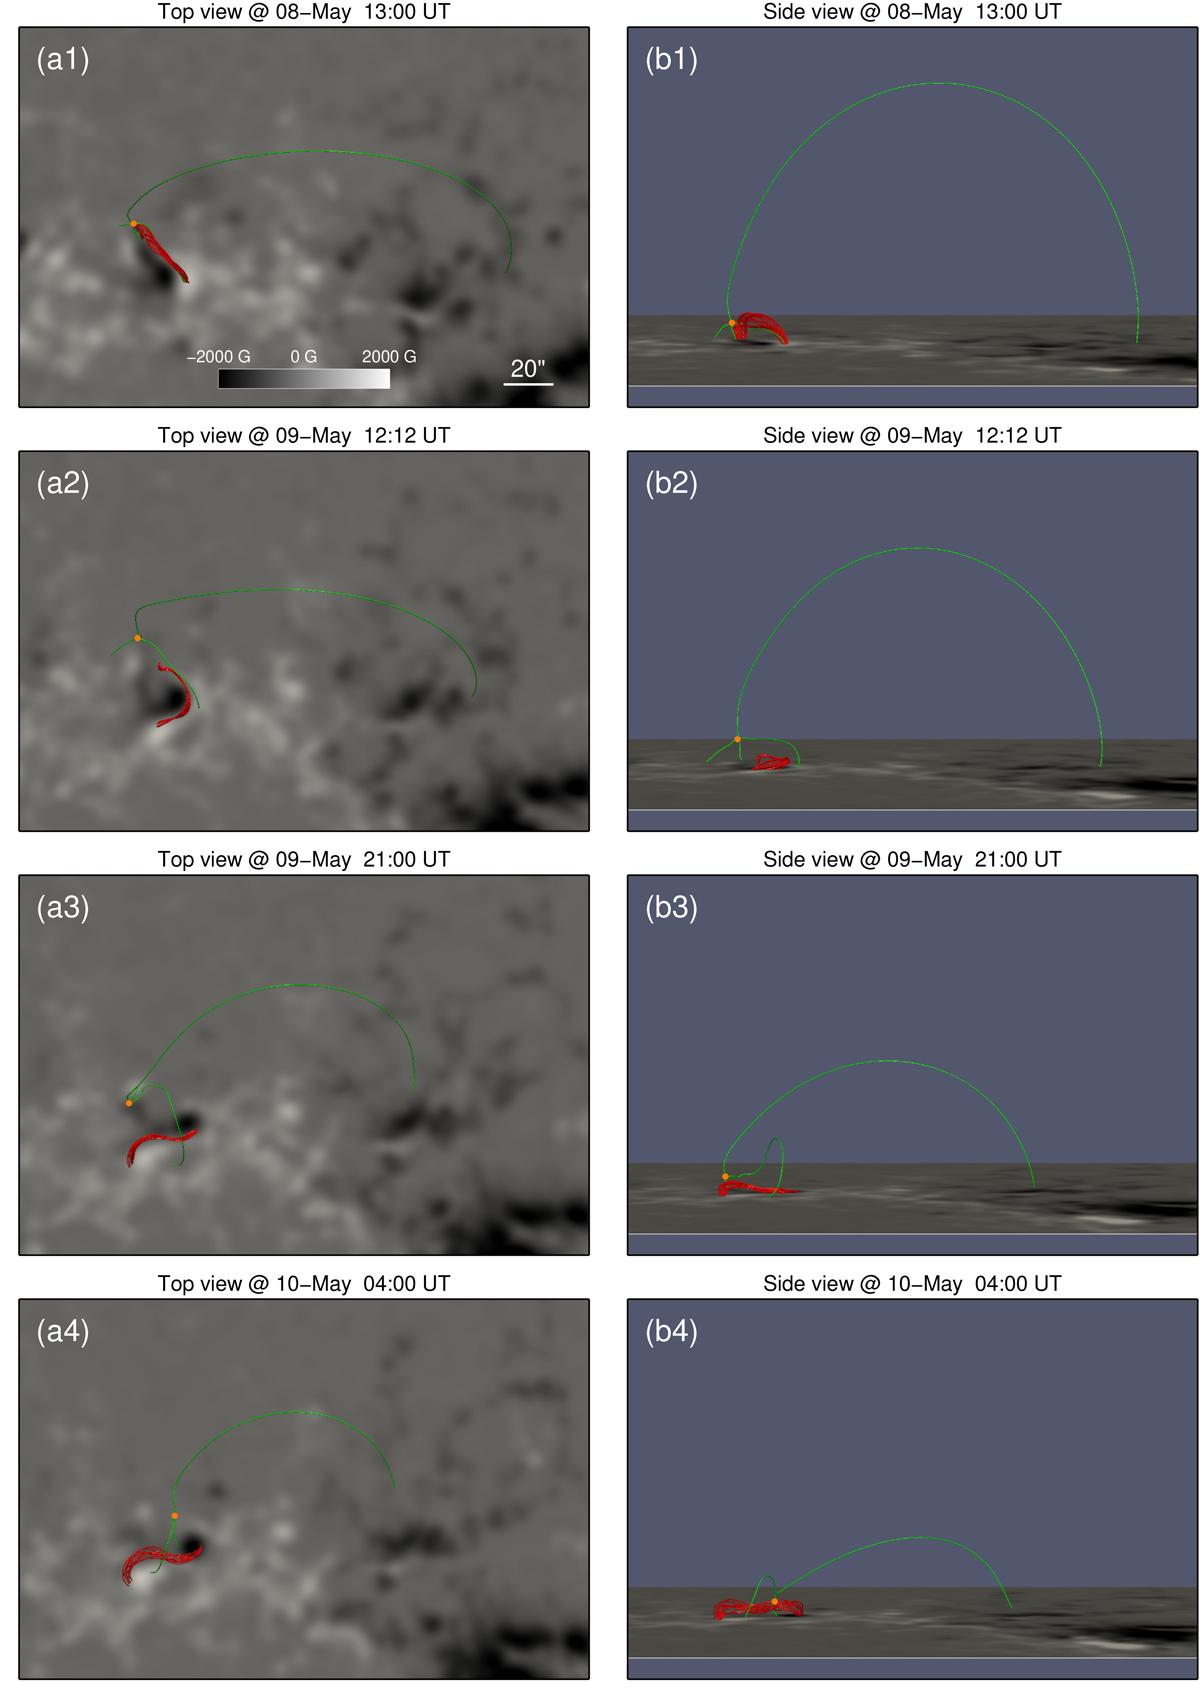
Fig. 6.
Download original image
Magnetic topology just before the occurrence of flares. (a1)–(a4) Top view of the skeletons of the fan-spine represented by green curves, together with the null points represented by the brown dot symbols. The red curves represent the magnetic flux ropes within the fan structures, and the backgrounds are vertical magnetograms taken at different times. (b1)–(b4) Similar to (a1)–(a4), but from a side perspective.
Current usage metrics show cumulative count of Article Views (full-text article views including HTML views, PDF and ePub downloads, according to the available data) and Abstracts Views on Vision4Press platform.
Data correspond to usage on the plateform after 2015. The current usage metrics is available 48-96 hours after online publication and is updated daily on week days.
Initial download of the metrics may take a while.